
Linton Price Targets API
Updata's ground breaking Linton Price Targets can now be added to your models using our Targets API
Updata developed an Application Programming Interface (API) for the Linton Price Targets in 2026, primarily for Banks and Hedge Funds to utilise for developing their own computer models internally. This effectively a light weight ‘black box’ which protects the core code that generates the Linton Price Targets from the price action of price histories that are fed to the API.
The API comes in a number of different variations including a web hosted version and a Dynamic Link Library (DLL) as well as comprehensive documentation and samples. All the construction variations mentioned throughout Predicting the Price are covered.
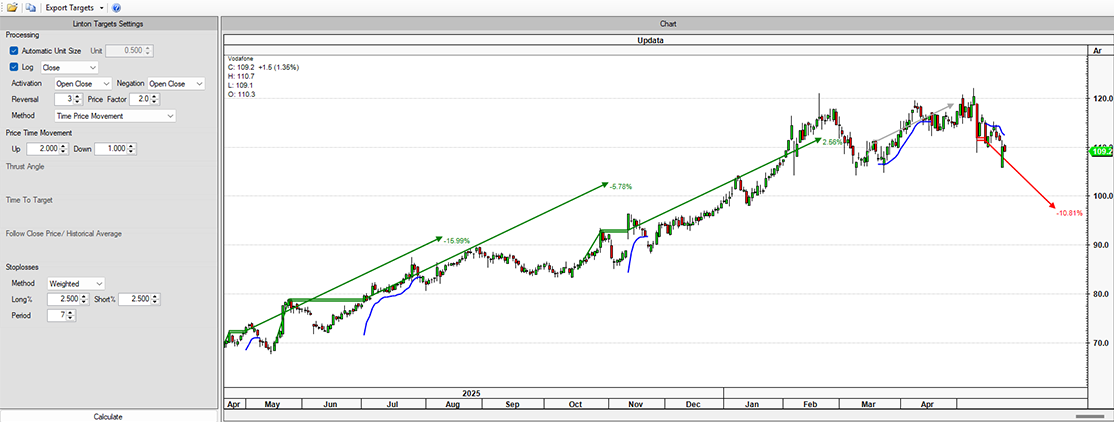
Programmers within financial institutions can utilise the API as well as software and website providers who want to integrate Linton Price Targets into their platforms. Below you can see basic interface where construction variables are added on the left and a simple chart with price targets is generated on the right.
For more info please email ta@updata.co.uk
Results from the API can output in a series of formats. Image 2 below shows results for all targets generated historically for a single instrument. Chart images and CSV files can be generated as a series of files in a directory as shown in image 3.
The results produced from the API can be output into other formats such as JavaScript Object Notation (JSON) as well. Image 4 shows an example of this output code.
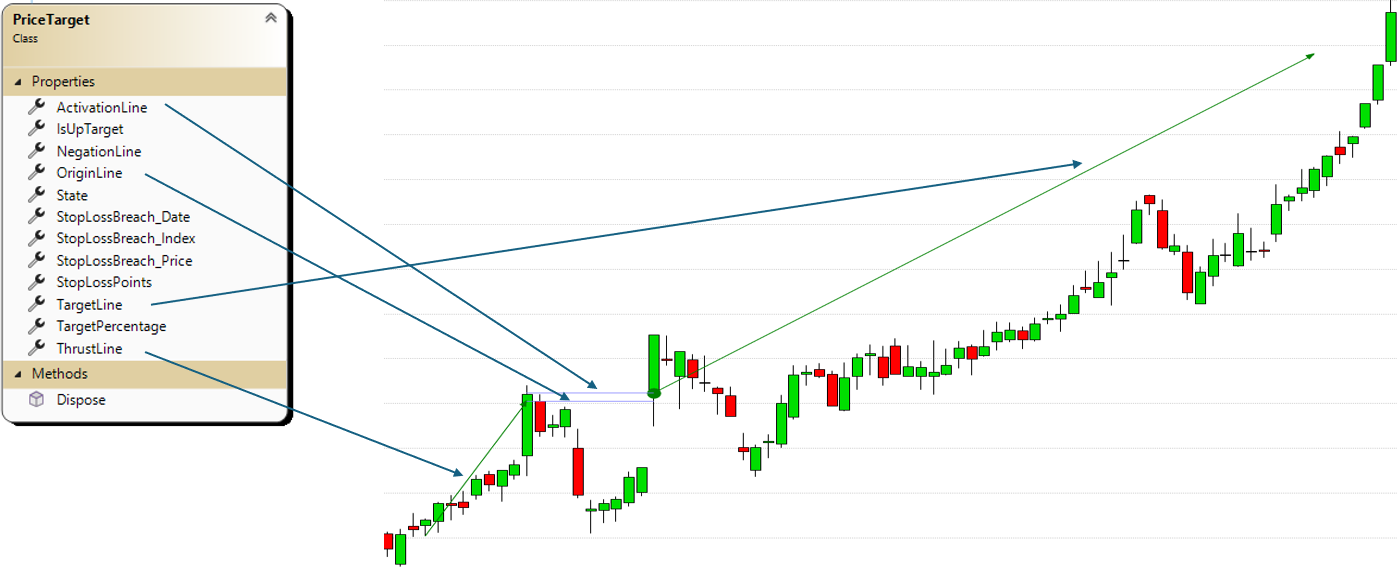
Image 1. Diagram showing how the API variables relate to the price targets on a chart
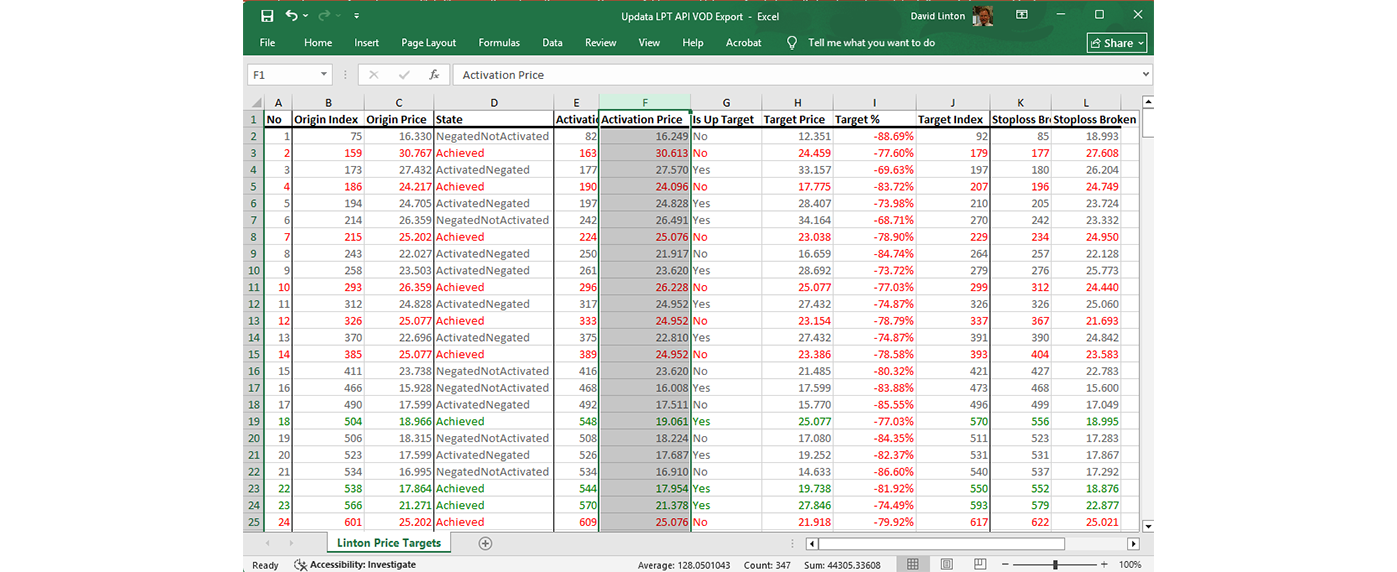
Image 2. API output results for all historical targets for a single price history in Microsoft Excel
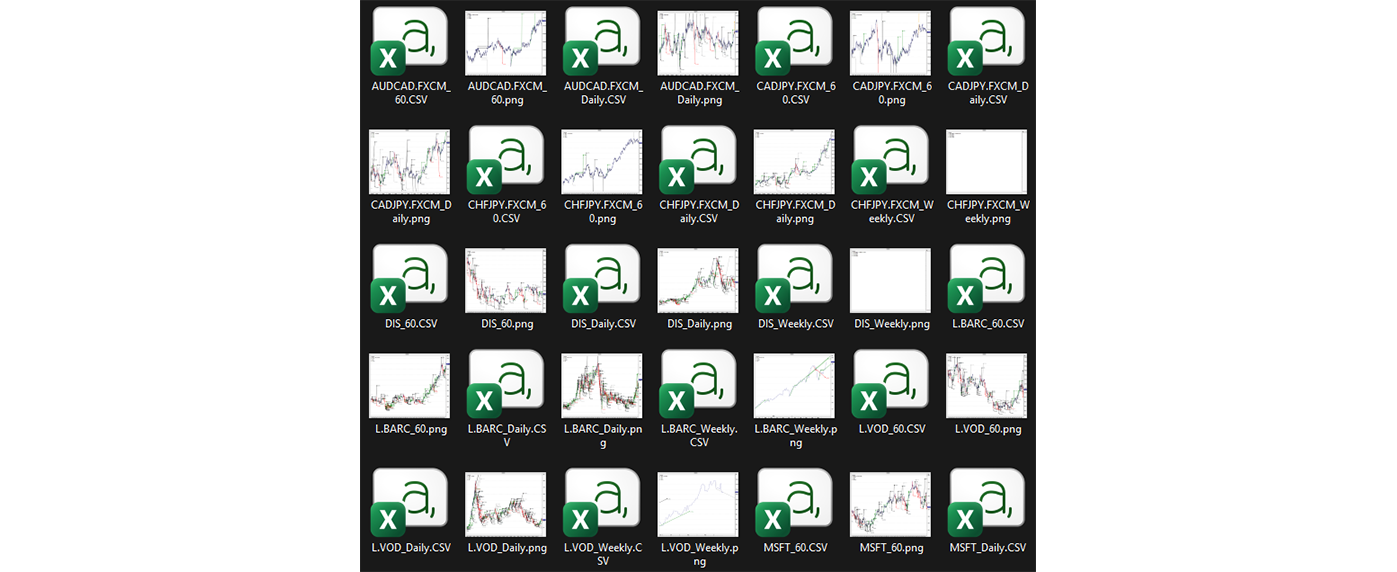
Image 3. chart images and CSV files generated from a series of files read by the API
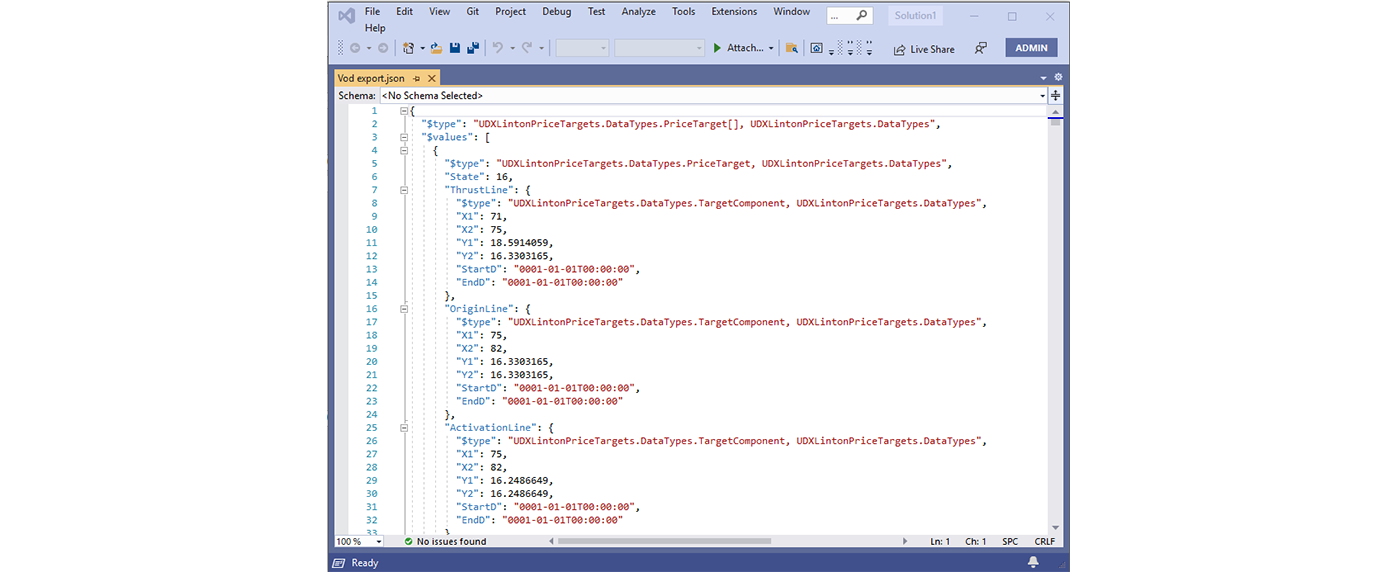
Image 4. API output results in JSON format
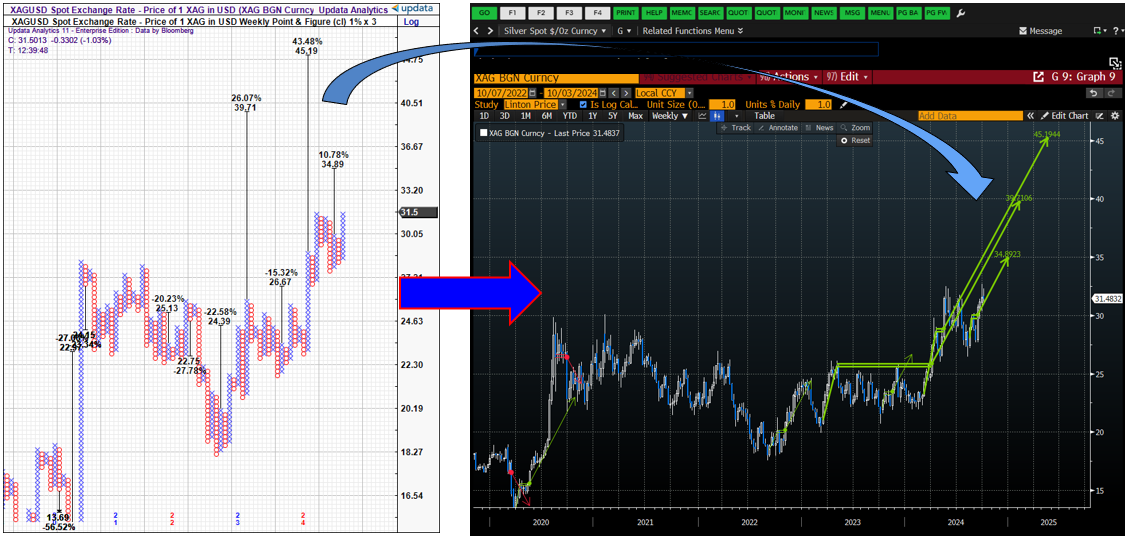
Linton Price Targets take point and figure targets, from the historic technical analysis technique, and re-imagine them. Point and figure charts haven been used for over 100 years but they have a few disadvantages:
- Proper point and figure charts are hard to get now (except in Updata)
- The charts are not easy for the newcomer to learn
- They are, sadly, considered old fashioned
- There is no time scale in the charts (the x axis is reversals)
- It is hard to know when a target is failing as time progresses
- Other time-based techniques can’t be used on point and figure
By applying the targets to a normal time-based price chart, Linton Price Targets are instantly easier to use. Crucially, this enables you to see when a target may be met and if it may be failing with the passage time.
In the demo below David Linton will take you through the calculation of the Linton Price Targets, showing how easy the Linton Price Targets are to use compared to Point and Figure charts.
