
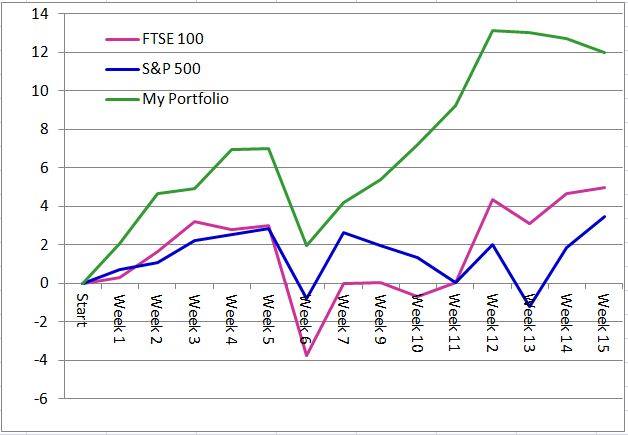
My Portfolio Performance - 12 month summary
David Linton, CEO Updata
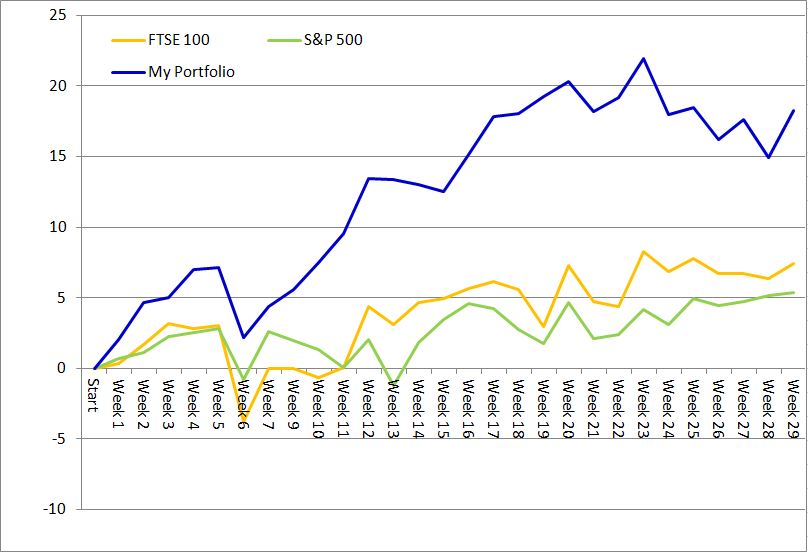
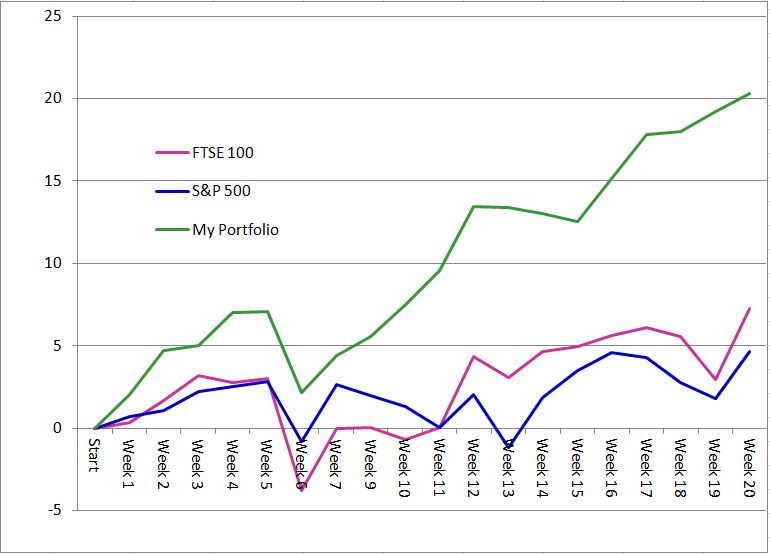
The technical analysis fund was run across a 12 month period to the end October 2015 using the Updata system. The starting capital for the test was £33,500 ($50,000) with small monthly payments into the fund. The investment universe was main market UK and US equities, though some investment trusts and ETFs were bought and sold in the year. The actual return including all fees was 20.3%. The UK FTSE 100 Index was down 2.8% over the period and the US S&P 500 Index up 3.0%.
The fund was run within a UK Self Invested Pension Plan (SIPP - like a 401K) and the provider charged quite high exchange rates for each trade in US stocks. The 2016 fund will be moved to a new provider, who allow a segregated dollar account within the SIPP. This will be done in the coming weeks ready for the test for the calendar year 2016. With this change alone, the fund would have returned 31.2% in the twelve months. This excludes compounding that would have translated to extra performance. The new provider's lower commissions would improve performance further to 33.3% and if larger amounts were employed, this would improve further to 35.1% across the year. The fund is up a further 3.6% (Week 53) this week.
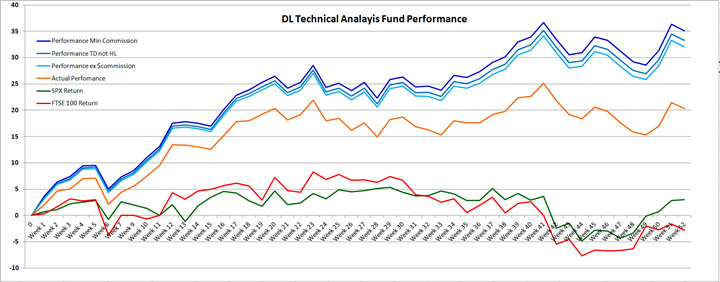
Further Performance Improvements
There are further enhancements to be made to the fund methodology ready for 2016. The number of positions taken in the year was 70. Just over half of these were US holdings, the rest UK. At the close of the 12 month period, 11 positions remained open - these holdings up an average of 13%.
Of the 70 investments (allowing for 3% FX fees):
- 38 winners, 32 losers - Hit rate of 54%, room for improvement here
- 7 holdings up over 20%, 2 up over 30%, 3 up over 40%
- 3 losers over 10% - 12, 14 & 17%
- Average hold period 60 calendar days
- Biggest up percentages missed since sale: 67, 53, 34, 30, 30, 39, 23 (mostly early holdings in year)
- Biggest down percentages missed since sale: -57, -56, -41, -26, -24, -23
A better monitoring process has been implemented to ensure improvement in the balance between running profits and cutting losses. There are also a few lessons for the two main periods of underperformance in the year which taken on board should boost next year's performance.
Methodology
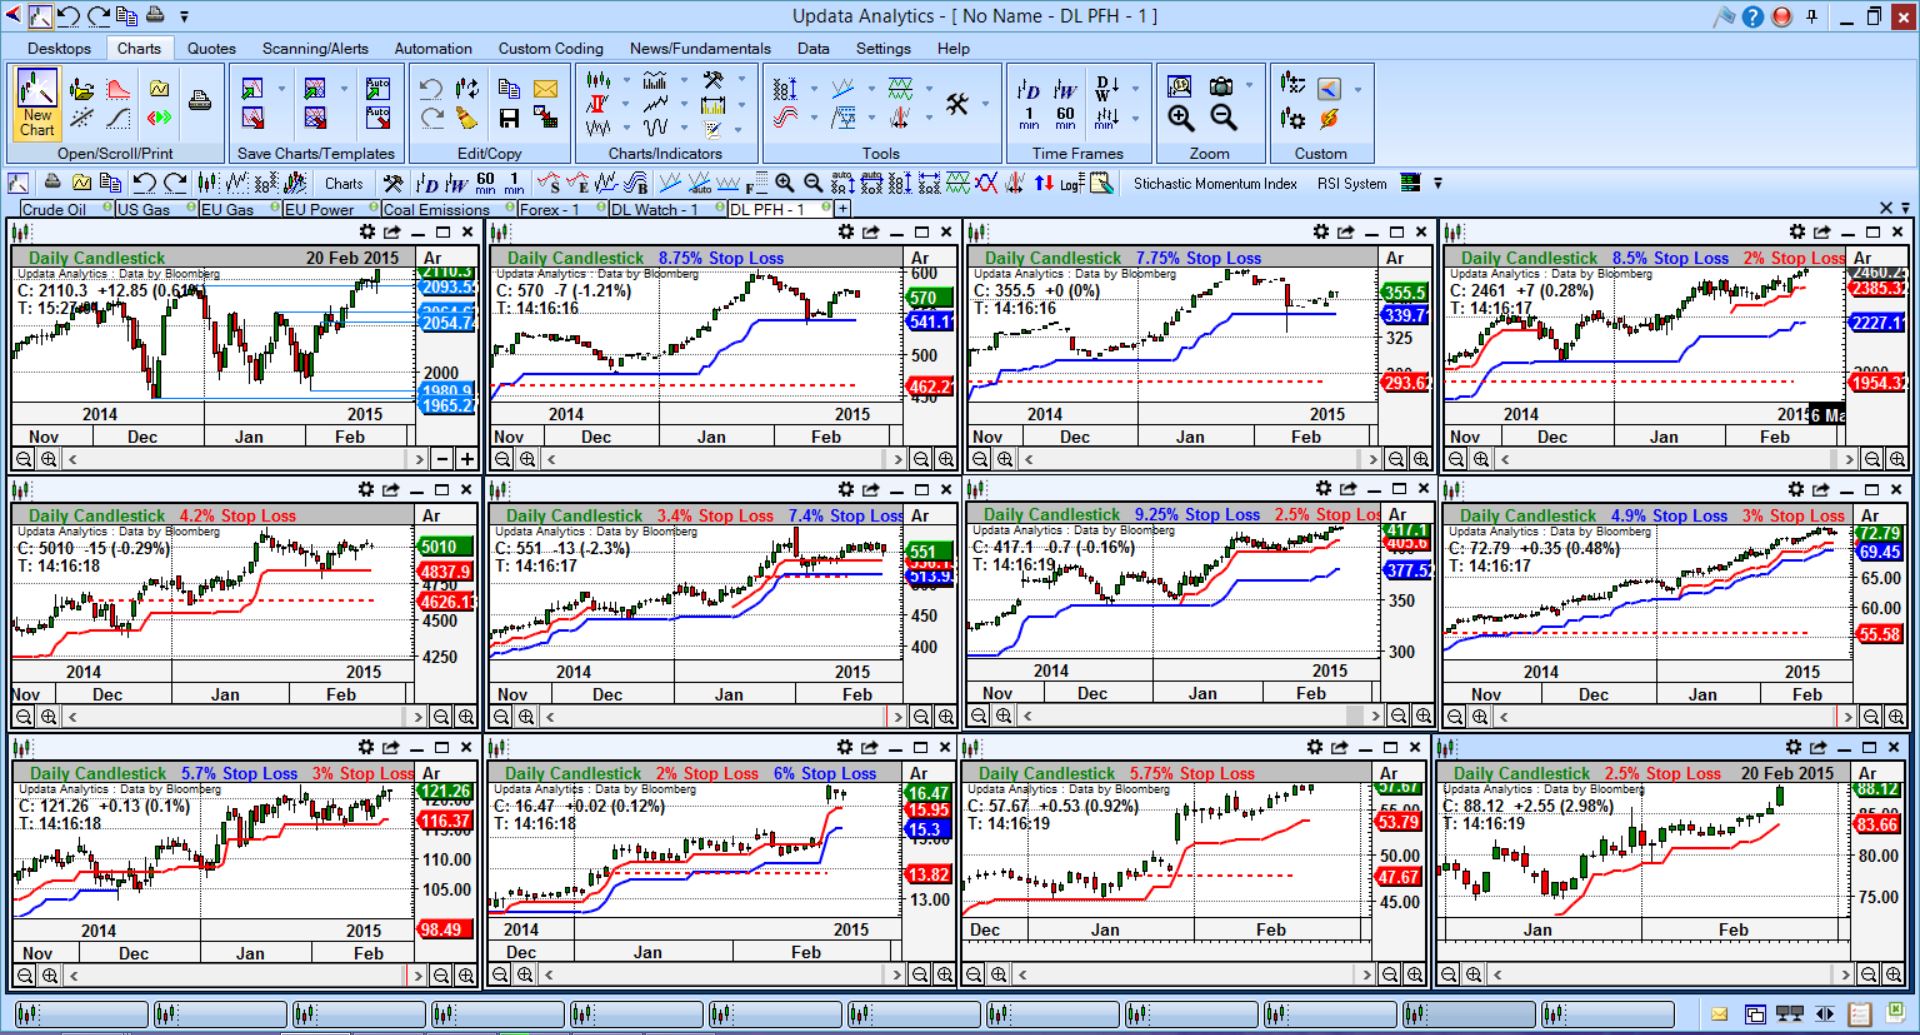
The strategy is a long only equities fund. The universe is currently US and UK stocks and funds, but could be extended to other major international markets. It is a strategy based purely on technical analysis using the UpdataAnalytics software for stock scanning and selection and monitoring.
The main rules are:
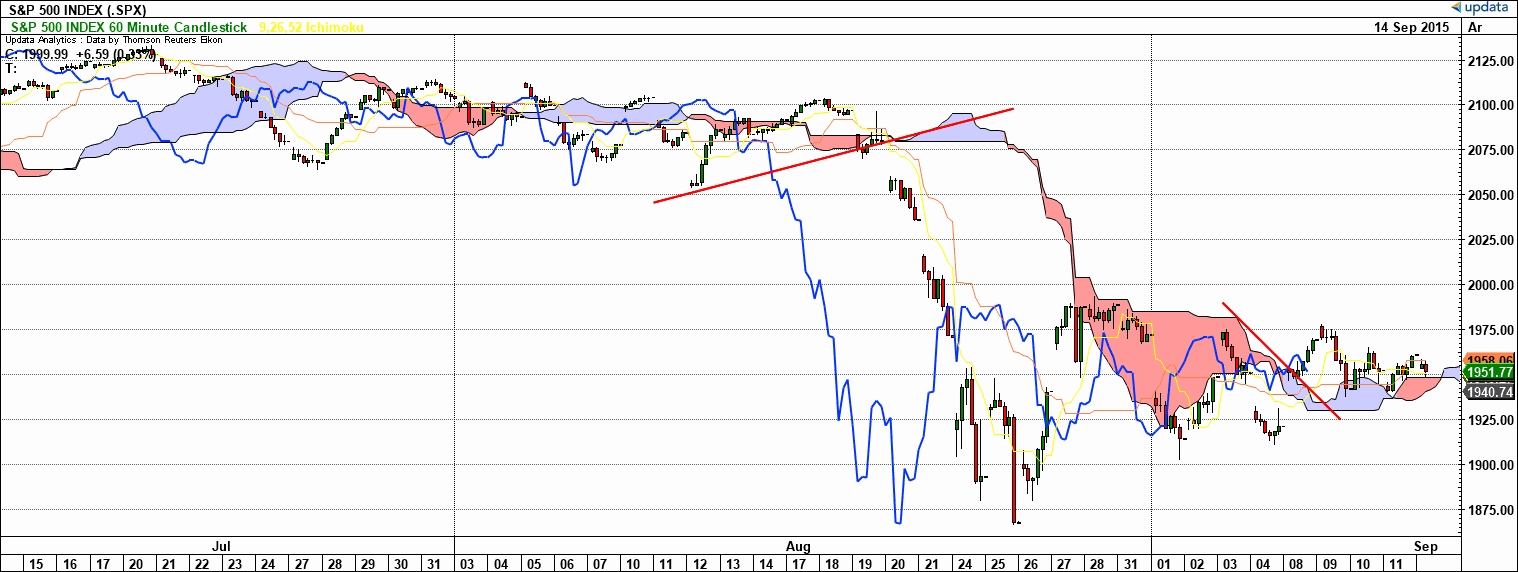
- 1. Using Ichimoku Cloud charts to define short, medium and long term trends for market state/weighting
- 2. Scanning stock universes for stocks with Point & Figure upside targets greater than 25%
- 3. Optimized trailing stoplosses to run profits and cut losses
Ichimoku Clouds - trend confirmation and monitoring
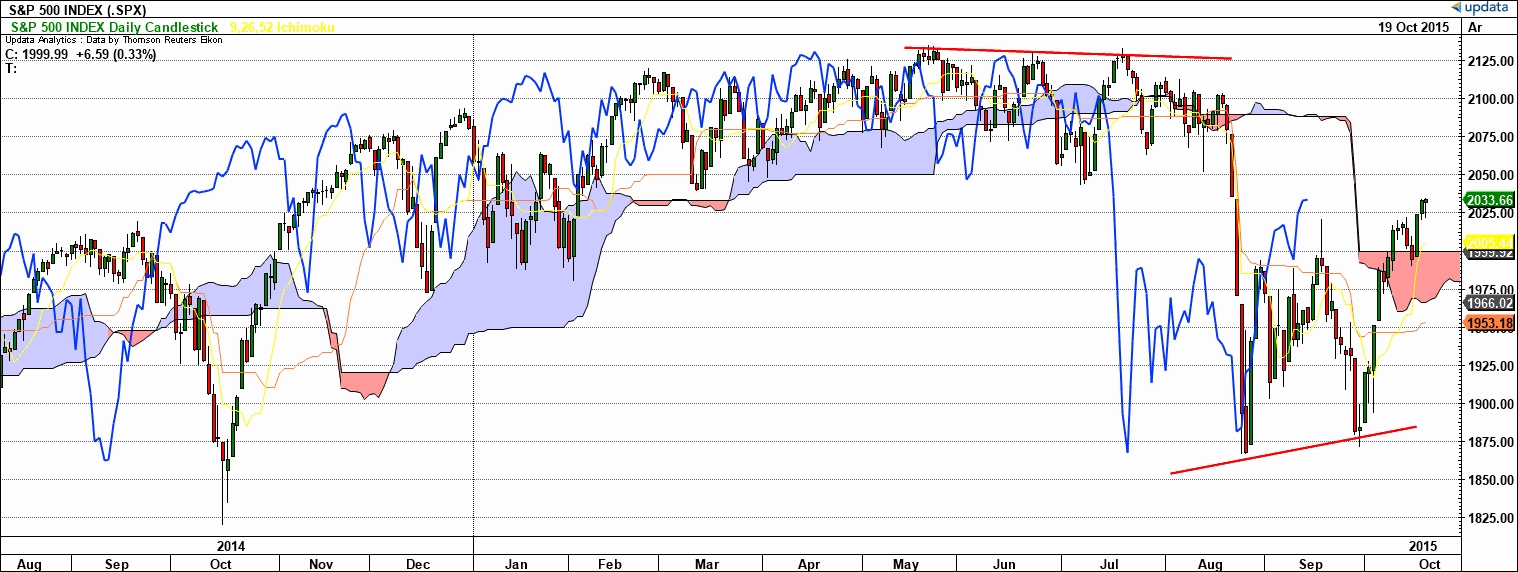
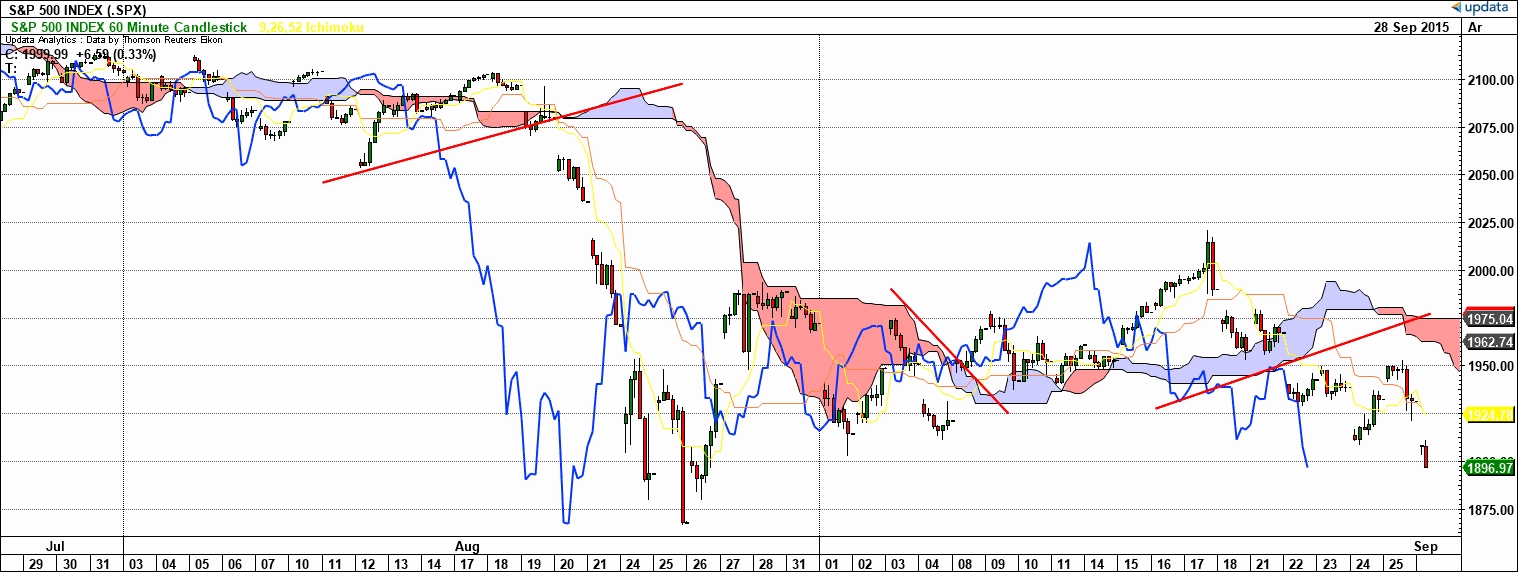
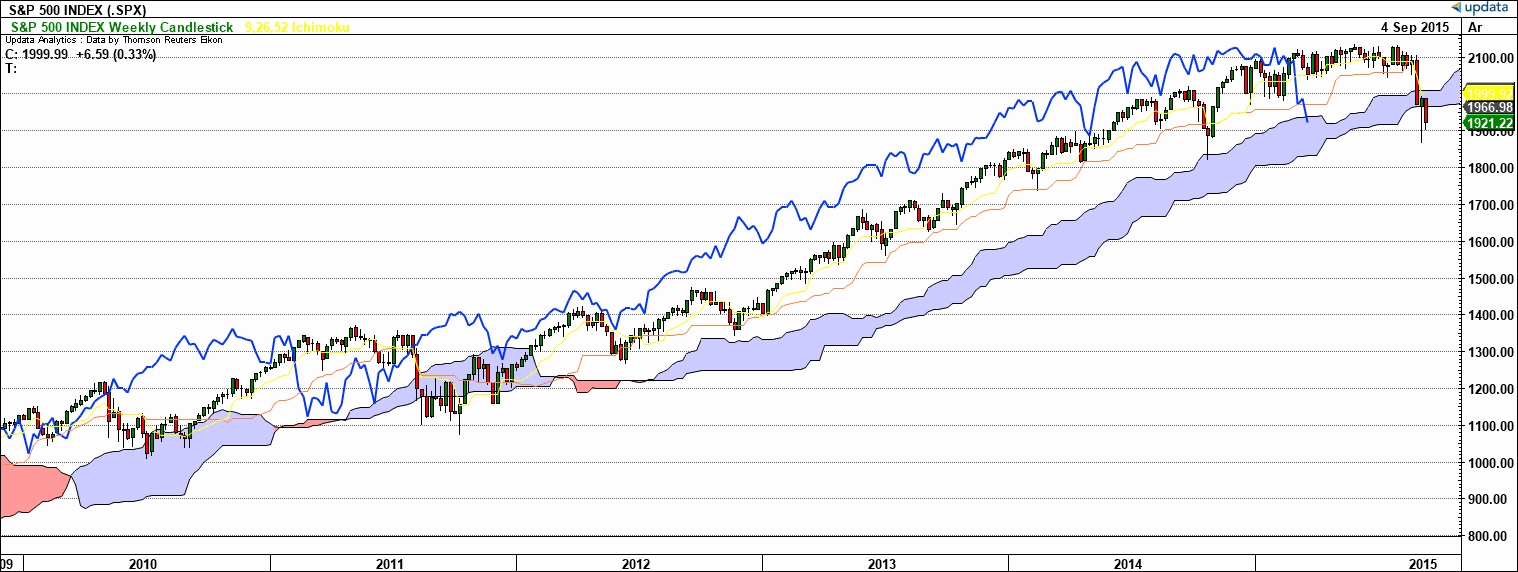
These charts were developed in Japan in the 1930s and are used for understanding the trends in the market. It is an objective technique, the only variable being time frame. It is one of the clearest ways of defining trend. Weekly charts are long term, daily - medium term and 60 minute charts are for short term and market timing.
These charts are also used in the stock selection and monitoring process to understand the long, medium and short term trends at all times. The complete reference is: Cloud Charts by David Linton
Point & Figure Charts - target scanning and monitoring
Point and Figure is a technical analysis technique that has been used for over a century. The price targets are based on buying and selling thrusts. Updata is the world leader in this technique. Large instrument universes are scanned daily looking for stocks with over 25% upside targets. Charts of 1% (long term), 0.5% (medium term) and 0.1% 60 minute charts (short term) are studied. Short lists are produced which are then analysed further to arrive at the very best handful of stocks. Reference: The Definitive Guide to Point and Figure, Jeremy du Plessis
Optimized Stoplosses - monitoring and risk management
Optimized stop-losses aim to trap abnormal retracements in stock prices but back-testing which percentage of trailing stop has worked best in historically. Each stock has it's own volatility signature and these tools are used to run profits and keep losses small. The objective is to lose no more than 10% on any one position and run profitable positions until they fall through their optimized stop (ideally no more than 10% retracement from a price peak). Reference: Optimization of Stoplosses, David Linton from International Federation of Technical Analysts Journal 2009
DL
MyPortfolio - WEEK 52
by David Linton, Updata CEO, London - 2 November
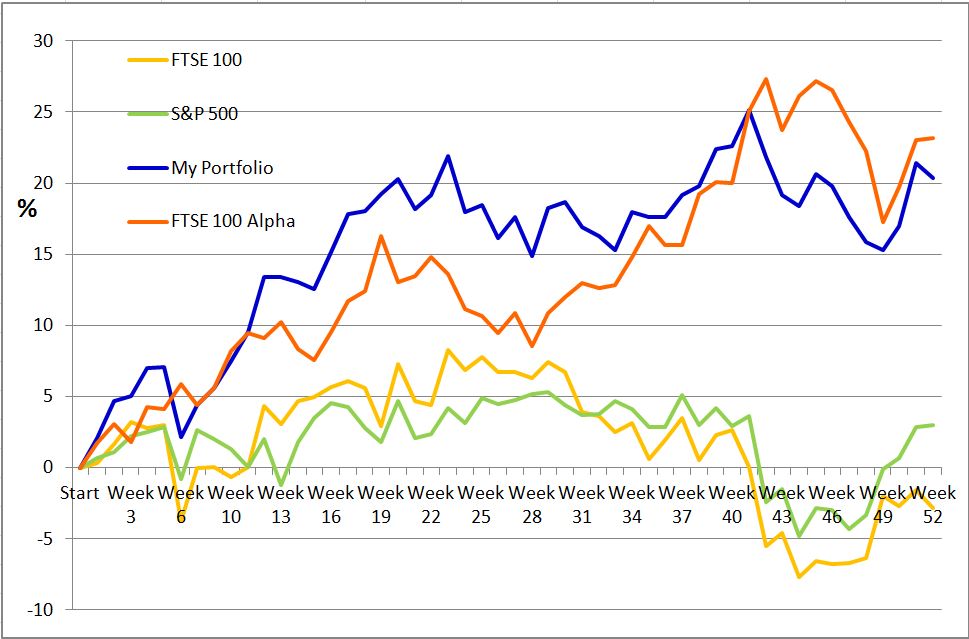
After 52 weeks, my portfolio is up 20.3% after costs
In my last week I was down just under 1%. The US was virtually unchanged and the UK was down 1.3%
Chg on week: S&P 500: +0.2%, FTSE 100: -1.3%, GBPUSD: +0.6% MyPortfolio: -0.9%
Not a great performance for the last week of my 12 month portfolio but I am please to hold my performance above 20%.
Over the course of the year the S&P 500 Index was up 3% and the FTSE 100 was down 3%. I could not have outperformed the market this much without Updata.
DL
MyPortfolio - WEEK 51
by David Linton, Updata CEO, London - 26 October
After 51 weeks, my portfolio is up 21.4% after costs
A very good week with my portfolio up 3.8% versus the S&P up 2.1%
Chg on week: S&P 500: +2.1%, FTSE 100: +1.1%, GBPUSD: -0.6% MyPortfolio: +3.8%
A very good performance for my second last week of this 12 month exercise. It would be good to hold the 20% performance for the year.
DL
MyPortfolio - WEEK 50
by David Linton, Updata CEO, London - 19 October
After 50 weeks, my portfolio is up 17.0% after costs
The US market rose by under 1% and the UK was down just under 1% - I was up 1.5%
Chg on week: S&P 500: +0.8%, FTSE 100: -0.7%, GBPUSD: +0.0% MyPortfolio: +1.5%
A better week at last. The last few months have been very difficult for maintaining performance. We can take some comfort from the second low being higher than the first. Prices are back above the cloud, but we have some way to go for the lagging line. Proceed with caution.
DL
MyPortfolio - WEEK 49
by David Linton, Updata CEO, London - 12 October
After 49 weeks, my portfolio is up 15.3% after costs
The US market rose by 3% and the UK strongly by nearly 5% - I was down 0.5%
Chg on week: S&P 500: +3.0%, FTSE 100: +4.6%, GBPUSD: +1.3% MyPortfolio: -0.5%
I was hit by the dollar a bit this week and also because I bought some new stocks anticipating a recovery now and took the dealing costs and spreads on the chin
DL
MyPortfolio - WEEK 48
by David Linton, Updata CEO, London - 5 October
After 48 weeks, my portfolio is up 15.9% after costs
The US market rose by 1% and the UK was barley changed - I was down 1.5%
Chg on week: S&P 500: +1.0%, FTSE 100: +0.3%, GBPUSD: -0.6% MyPortfolio: -1.5%
Not a great week performance wise partly because I was underweight and reduced some holdings further in the week taking some small losses.
DL
MyPortfolio - WEEK 47
by David Linton, Updata CEO, London - 28 September
After 47 weeks, my portfolio is up 17.6% after costs
The US market fell again, down 1.4% on the week - I was down 1.8%
Chg on week: S&P 500: -1.4%, FTSE 100: +0.1%, GBPUSD: -1.3% MyPortfolio: -1.8%
The short term recovery in the US failed last week and we are back below the cloud again on the short term 60 minute chart. This robbed my performance and with a bit of selling I am back to underweight again.
DL
MyPortfolio - WEEK 46
by David Linton, Updata CEO, London - 21 September
After 46 weeks, my portfolio is up 19.8% after costs
The markets were virtually unchanged on the week - I was down 0.7%
Chg on week: S&P 500: -0.1%, FTSE 100: -0.2%, GBPUSD: +0.6% MyPortfolio: -0.7%
A fairly uneventful week in the market. My portfolio was down 0.7% in line with the rise in Sterling.
DL
MyPortfolio - WEEK 45
by David Linton, Updata CEO, London - 14 September
After 45 weeks, my portfolio is up 20.6% after costs
The US was up 2% and the UK up just over 1% - I was up 1.9%
Chg on week: S&P 500: 2.1%, FTSE 100: +1.2%, GBPUSD: +1.3% MyPortfolio: +1.9%
I faired Ok this week in line with the US market which I am please with given that Sterling rose by over 1%. It is a relief to see the market recovering. We are back through the 60 minute cloud on the S&P 500.
DL
MyPortfolio - WEEK 44
by David Linton, Updata CEO, London - 7 September
After 44 weeks, my portfolio is up 18.4% after costs
Markets fell again with the US and the UK down by more than 3% - I was only down 0.6%
Chg on week: S&P 500: -3.4%, FTSE 100: -3.3%, GBPUSD: -1.9% MyPortfolio: -0.6%
The market conditions make long investments difficult and the weekly cloud, our roadmap, for a bull market is showing signs of strain with prices back below the cloud. I am now underweight with the risk of further falls, but this also means I will lose some performance on a potential recovery off the lows as well.
DL
MyPortfolio - WEEK 43
by David Linton, Updata CEO, London - 31 August
After 43 weeks, my portfolio is up 19.2% after costs
Markets recovered slightly with the US and the UK recovering just under 1% - I was down 2.2%
Chg on week: S&P 500: +0.9%, FTSE 100: +0.9%, GBPUSD: -0.6% MyPortfolio: -2.2%
One of the problems with selling stocks in a falling market, is you lose some of the performance when it bounces back.
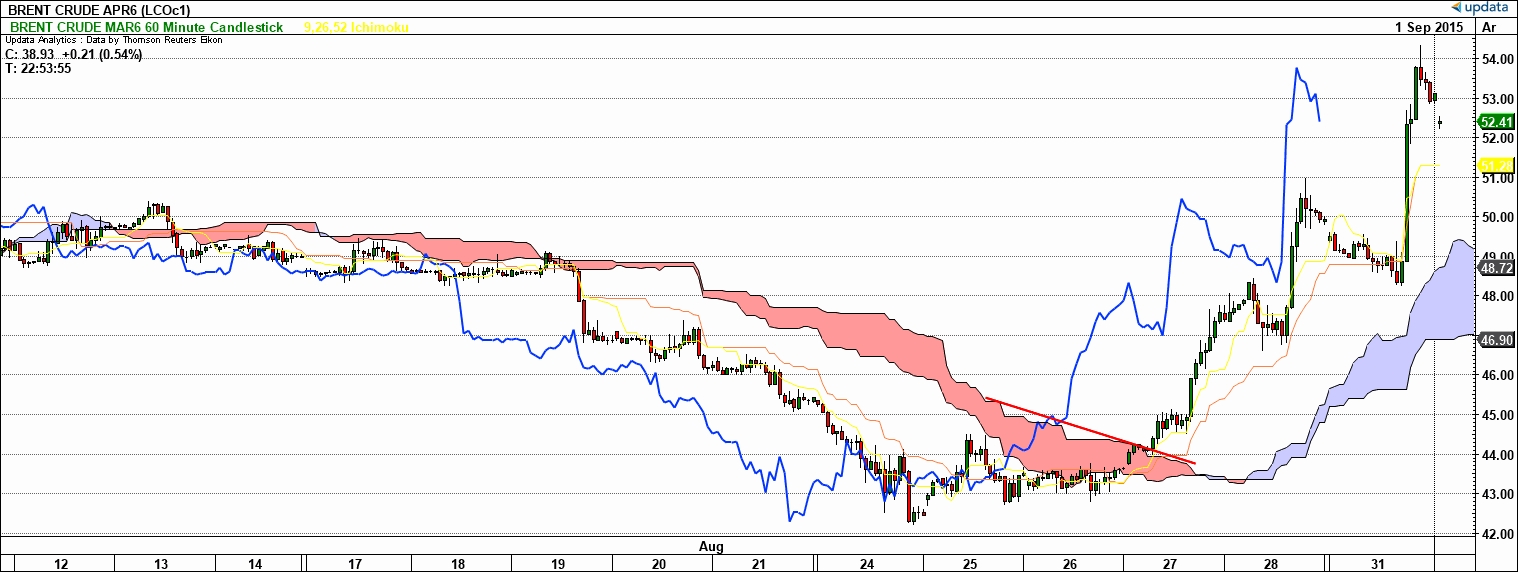
But where my performance git hit this week was a dramatic recovery in Oil. I should have exited sooner, but was away from a screen quite a bit in the week. This is one of the problems of short EFTs. They can erode in value very quickly.
DL
MyPortfolio - WEEK 42
by David Linton, Updata CEO, London - 24 August
After 42 weeks, my portfolio is up 21.8% after costs
Markets had a dire week with the US and the UK down 5.5% - I was down 2.6%
Chg on week: S&P 500: -5.8%, FTSE 100: -5.5%, WTI: -5.2%, GBPUSD: +0.0% MyPortfolio: -2.6%
Markets had a dire week after big sell off in all stock markets. I started moving some holdings into cash, but with prices falling so fast there is always the risk you sell a bottom and then miss the bounce. The ideal is to sell into the fall and buy into the rise at hopefully a higher price. At times like this, I take a closer at the markets doing my usual analysis on Weekly, Daily and 60 minute cloud charts (long, medium and short term) and 1% daily, 0.5% daily and 0.1% 60 minute log scale point and figure charts. I then colour code the cells accordingly so I can see at a glance where the problems are. The short term will nearly always change quickly. It is the medium term that counts and where I am most watchful of things changing. I also give an overall gut feel based on this analysis and the charts. On this basis I reckoned the FTSE 100 looked worse than the US indices and weighted my UK holdings down by half.
For my stocks I have the added columns of Relative Strength and On Balance Volume on the daily charts. Nearly everything is falling so it is important to look to the relatives to understand what moves are the market and what are my stocks. My UK holdings 1&3 are marked in red and were sold on Friday morning. The US ones marked in orange are top of my list to sell and this will be mostly about finding the best exit opportunity on the short term charts.
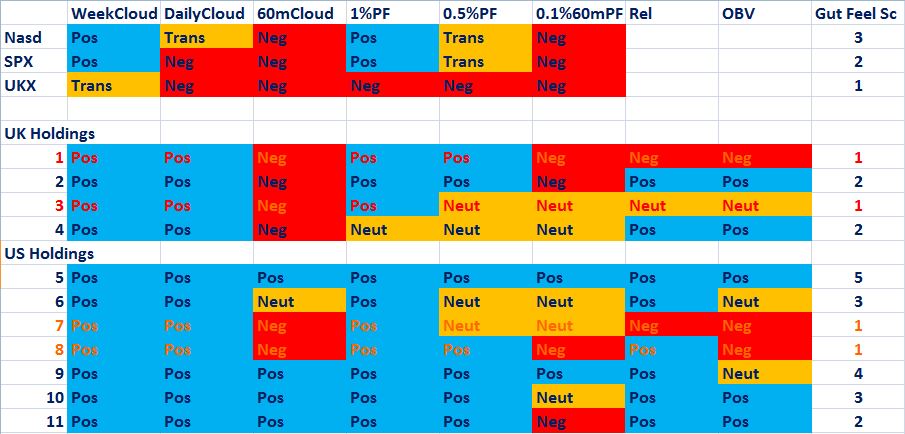
My oil short ETF continues to boom which has been a great hedge on the portfolio and one of my smaller Nasdaq stocks, recently purchased on my scans for upside targets, has been bucking the trend and is moving up nicely. The main thing this week will be to sell the bad looking holdings into strength and then wait with the cash for any signs of a bottom and a new move up.
DL
MyPortfolio - WEEK 41
by David Linton, Updata CEO, London - 17 August
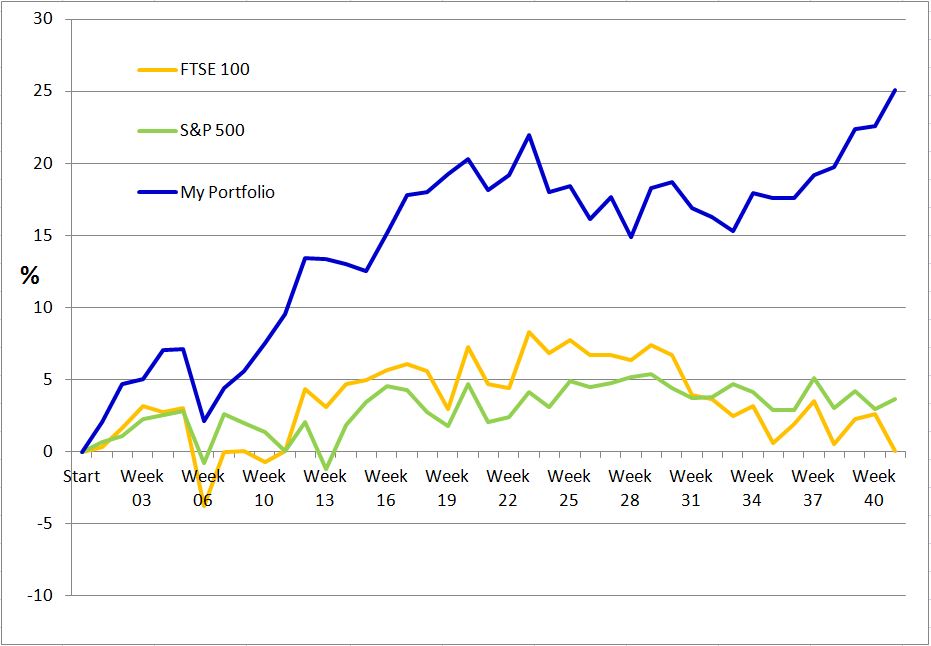
After 41 weeks, my portfolio is up 25.1% after costs
Markets had a mixed week with the US down and the UK and my portfolio up slightly
Chg on week: S&P 500: +0.7%, FTSE 100: -2.5%, WTI: -3.1%, GBPUSD: +0.6% MyPortfolio: +2.0%
I wasn't very focused on my portfolio this week with my annual week of yacht racing in southern England. I took the unusual step of keeping around 20% of my portfolio in cash after disposals at the end of the week before. Had I not been away I would probably have done the work to find some new stocks to invest in. I hate being in cash on basis that I reckon I can always find something that will do better. So with no trades in the week and not being fully invested, I ended up 2% up in a week that the UK market fell. Next week I will look to invest the cash in the best looking one or two stocks I can find with my scans for upside potential.
DL
MyPortfolio - WEEK 40
by David Linton, Updata CEO, Isle of Wight - 10 August
After 40 weeks, my portfolio is up 22.6% after costs
Markets had a mixed week with the US down and the UK and my portfolio up slightly
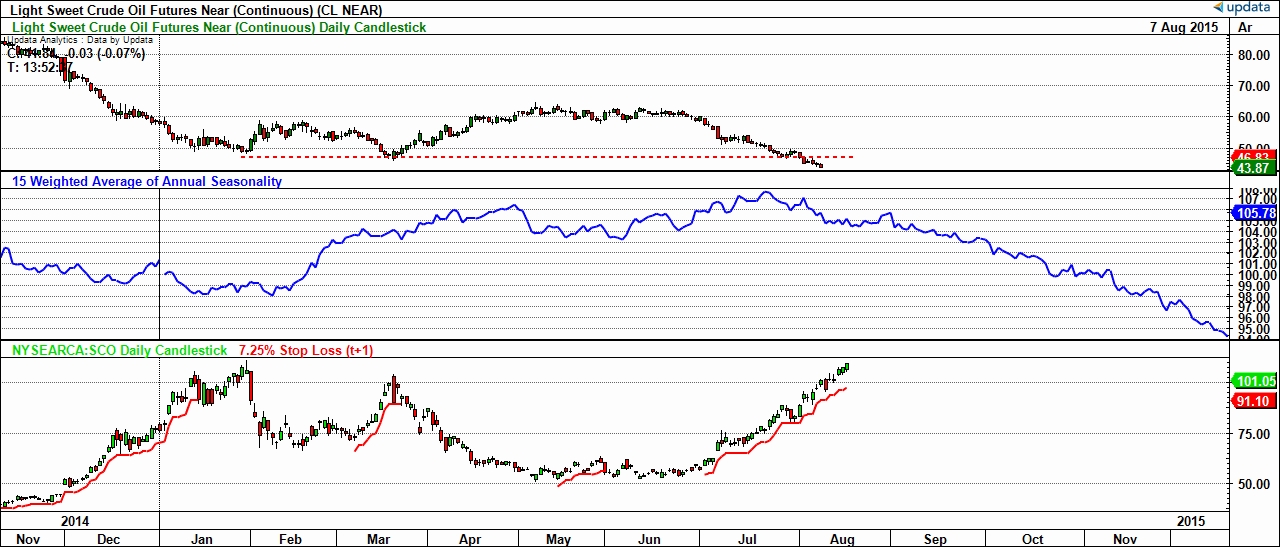
Chg on week: S&P 500: -1.2%, FTSE 100: +0.3%, WTI: -6.7%, GBPUSD: -0.6% MyPortfolio: +0.2%
A couple of weeks ago I explained here that I was taking out a short ETF on crude oil. The case for crude falling in the months ahead was so compelling and I kicked myself that I didn't do it last year. This is double short ETF (chart in bottom window from Google Finance) which goes up around twice the amount that oil falls. With crude down this week by almost 7%, this produced a great result. Unfortunately I was hit on some new US biotech purchases. They looked great on the charts but sold off with a general rout in the sector and volatility around results. Late on Friday (from my boat ahead of Cowes Week Regatta) I decided to sell out of a couple of these and sit on the cash with a week of racing ahead.
DL
MyPortfolio - WEEK 39
by David Linton, Updata CEO, London - 3 August
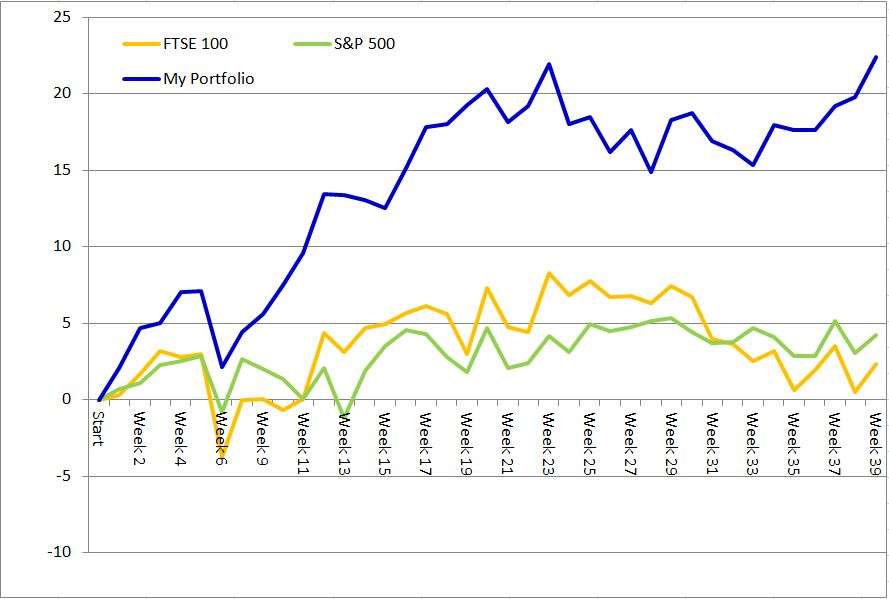
After 39 weeks, my portfolio is up 22.4% after costs
Markets had a good week with the US up 1% and the UK up 2%, I was up 2% as well
Chg on week: S&P 500: +1.1%, FTSE 100: +2.3%, WTI: -2.1%, GBPUSD: +0.6% MyPortfolio: 2.2%
I made no trades in the week and was away for a few days. The US was weaker than the UK and Sterling was stronger, but my US holdings still outperformed. One of my UK stocks was 8% on Friday on a positive trading statement. Good news happens in uptrends. The thing I am most pleased about is my portfolio return has passed its previous peak set a few months ago. It has been a difficult time with the market falling several percent and I am happy to now be up over this period. This is the sort of divergent performance I look for. Since I started, I am up 22.4% versus the FTSE 100 up 2.3% in that time. But there are still a few of my holdings that worry me slightly. Basically their charts are not making new highs. These are the ones I watch most and I will look for new better looking opportunities this week, if they don't improve.
DL
MyPortfolio - WEEK 38
by David Linton, Updata CEO, London - 26 July
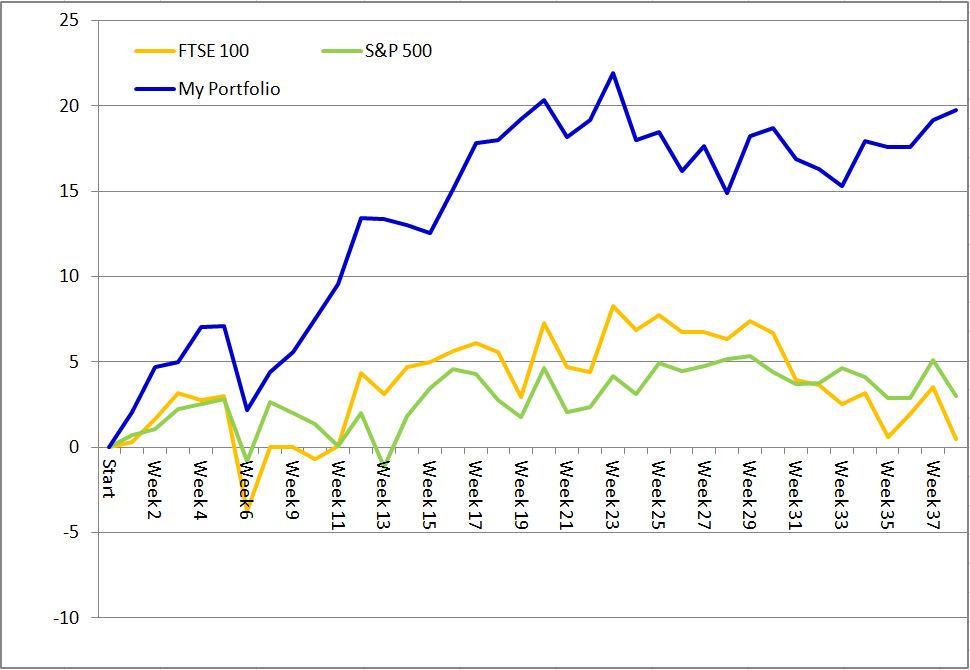
After 38 weeks, my portfolio is up 19.8% after costs
Markets had a bad week falling 2% in the US and 3% in the UK, but I was up slightly
Chg on week: S&P 500: -2.0%, FTSE 100: -2.9%, WTI: -3.2%%, GBPUSD: -3.1% MyPortfolio: 0.5%
Markets fell towards the end of the week and the shorter term outlook for the main indices now looks less favourable. The S&P 500 Index still looks bullish medium to long term, but a close below 2,050 points would be worrying. The chart of my performance below shows how with a bit more active management in the last few weeks, I have managed to out-perform the market. Of course I couldn't do it without Updata - 1) for picking stocks with the best upside potential 2) optimised stop-losses to ensure I cut losses and run profits.
DL
MyPortfolio - WEEK 37
by David Linton, Updata CEO, London - 19 July
After 37 weeks, my portfolio is up 19.2% after costs
Markets recovered fairly strongly last week and I went up with them
Chg on week: S&P 500: +2.2%, FTSE 100: +1.5%, WTI: -3.5%%, GBPUSD: +0.6% MyPortfolio: 1.3%
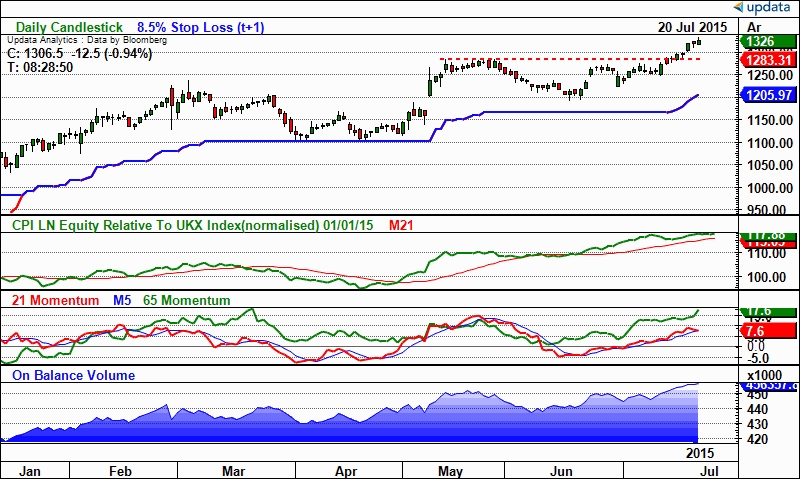
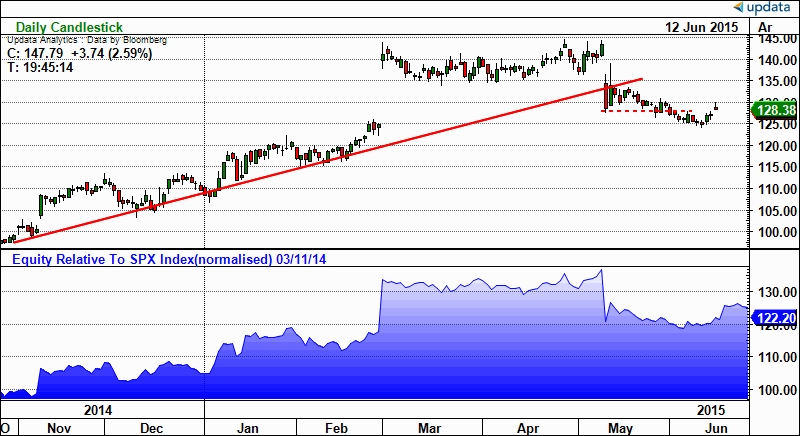
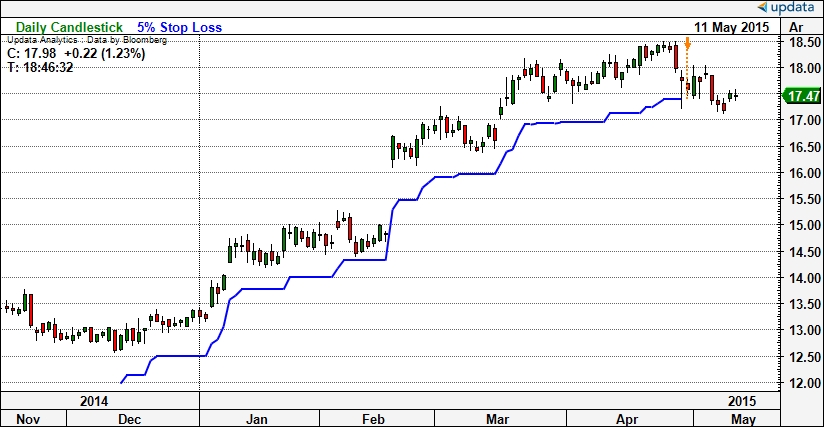
The FTSE 100 is recovering and Sterling looking stronger than the dollar, so I decided this week to sell my worst looking US stock and buy the best looking FTSE 100 blue chip stock. The chart below is that. Strong point and figure target, breaking to new highs, good relative strength, rising momentum and on-balance volume also making new highs. A good looking stock. You can nearly always find something better than your worst looking holding.
DL
MyPortfolio - WEEK 36
by David Linton, Updata CEO, London - 12 July
After 36 weeks, my portfolio is up 17.6% after costs
FTSE 100 rebounded but the US was flat, so was I.
Chg on week: S&P 500: 0.0%, FTSE 100: +1.3%, WTI: -0.5%%, GBPUSD: -0.6% MyPortfolio: 0.0%
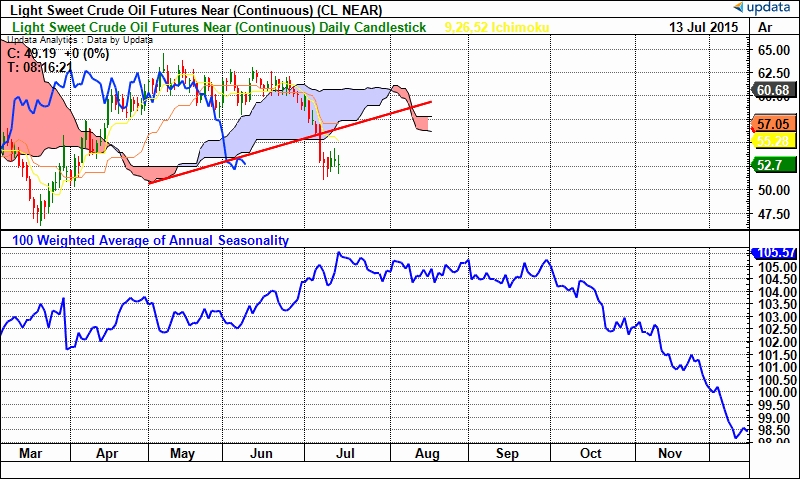
Because I am generally buying stocks with the best upside breaking to new highs, I have come to learn I don't perform so well when the market rebounds off its lows. The stocks that have plummeted recover strongly, while the ones that didn't fall so much don't. Oil gave a very clear signal on the cloud chart moving back into bearish territory. The seasonality shows we are heading into a bad time of year. Brent from Blacklion Capital has put some great reports up in the User Research area on the Updata Website analysing the fundamentals of crude using Updata. And I wrote a report for our institutional clients. Everything points south for crude so I bought a short ETF which is a bit more risky, but should insulate me as a hedge if markets fall further on more bad global macro news.
DL
MyPortfolio - WEEK 35
by David Linton, Updata CEO, London - 5 July
After 35 weeks, my portfolio is up 17.6% after costs
Another bad week for markets, but I outperformed ending up down a fraction
Chg on week: S&P 500: -1.2%, FTSE 100: -2.5%, GBPUSD: -0.6% MyPortfolio: -0.3%
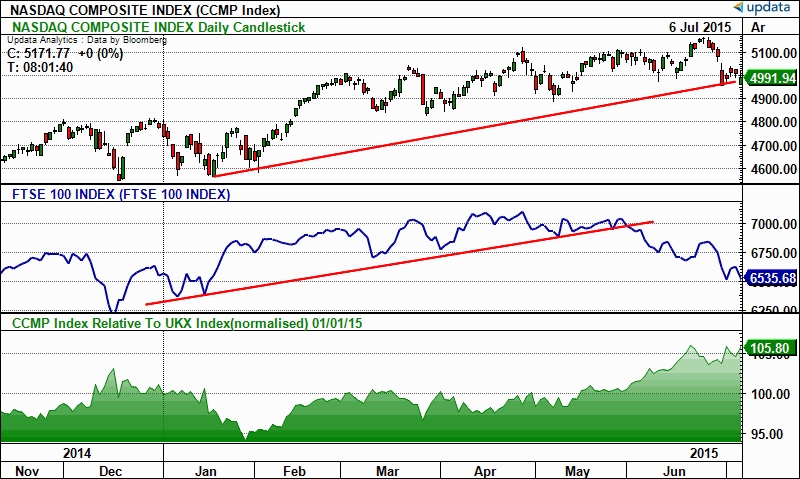
I didn't make any trades this week, and faired quite well with my holdings outperforming overall. The UK is really underperforming the US. The broader Nasdaq has outperformed the UK by 6% already this year and the chart is holding up. This coming week I will run scans on the broader Nasdaq for stocks with the best upside.
DL
MyPortfolio - WEEK 34
by David Linton, Updata CEO, London - 28 June
After 34 weeks, my portfolio is up 18.0% after costs
Markets mixed, dollar stronger - getting performance back
Chg on week: S&P 500: -0.5%, FTSE 100: +0.6%, GBPUSD: -1.3% MyPortfolio: +2.3%
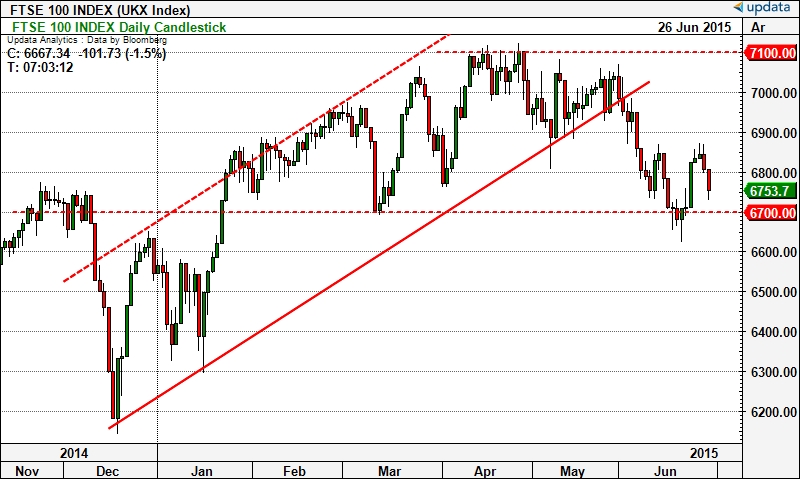
I didn't make any trades this week, but did quite well with my holdings outperforming. The stronger dollar helped. The UK market is on a knife edge having broken down a few weeks ago. We need 6,700 points to hold. June is a month, I will happily put behind me.
DL
MyPortfolio - WEEK 33
by David Linton, Updata CEO, London - 21 June
After 33 weeks, my portfolio is up 15.3% after costs
Markets fairly flat, I was down slightly again on weaker dollar
Chg on week: S&P 500: +0.9%, FTSE 100: -1.1%, GBPUSD: +1.9% MyPortfolio: -0.8%
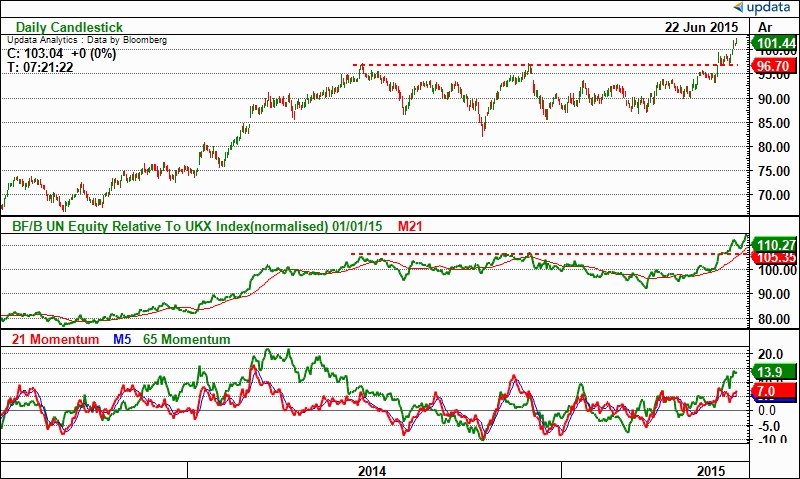
I ran my scans on the UK market this week hoping to find something better than one of my poor UK performers. But there was many compelling options with the state of the UK market, so I searched in the US. Looking for stocks with 30% upside on targets, I found a good looking US candidate in the S&P 500 Index. I then like to switch from the point and figure chart to look at the pattern in the line chart. The chart below shows the sort of stock I look for. A break to new highs after a long period of consolidation, strong relative strength and good momentum. So I switched into this one. Only the one trade for the week.
DL
MyPortfolio - WEEK 32
by David Linton, Updata CEO, London - 14 June
After 32 weeks, my portfolio is up 16.3% after costs
Markets fairly flat, down on weaker dollar and buying and selling stocks
Chg on week: S&P 500: -0.0%, FTSE 100: -0.3%, GBPUSD: +2.6% MyPortfolio: -0.5%
A late spring clean of my portfolio this week meant finding newcomers with better upside potential. This stock looked great when I bought it months ago but it looks less good now and the market doesn't care where you bought. It has done me proud, but it has taken too long to recover, so I sold it this week and banked the profit. It might come back in future scans, but right now it is costing me weekly performance.
DL
MyPortfolio - WEEK 31
by David Linton, Updata CEO, London - 7 June
After 31 weeks, my portfolio is up 16.9% after costs
Big falls in the FTSE 100 made making money hard this week
Chg on week: S&P 500: -0.7%, FTSE 100: -2.6%, GBPUSD: 0.0% MyPortfolio: -1.5%
With markets now starting to fall out of bed, I will need to take a good look at my stocks next week.
DL
MyPortfolio - WEEK 30
by David Linton, Updata CEO, London - 31 May
After 30 weeks, my portfolio is up 18.7% after costs
Markets were down this week, but I was up on a stronger dollar
Chg on week: S&P 500: -0.9%, FTSE 100: -0.7%, GBPUSD: -1.9% MyPortfolio: +0.4%
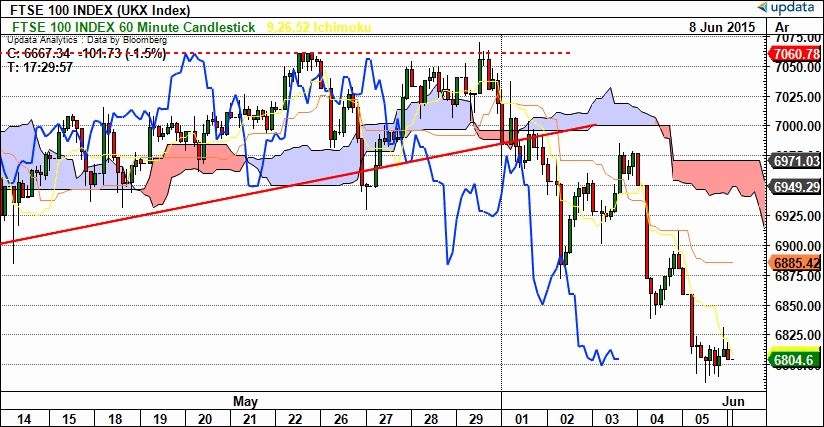
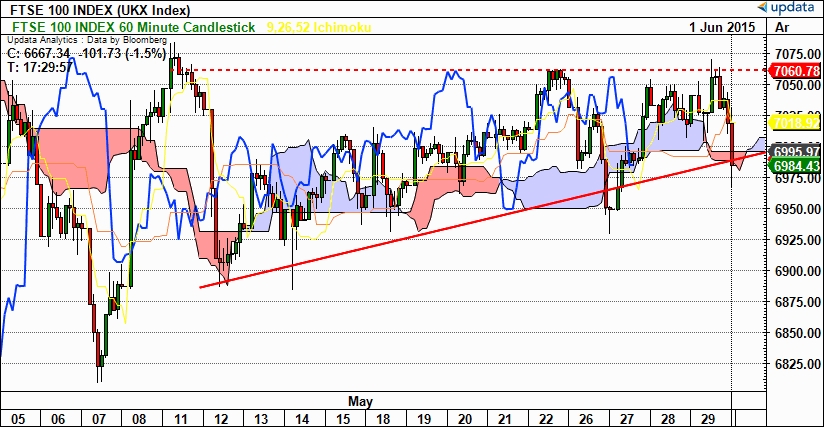
Markets were down slightly on the week, but are looking a bit worrying as the struggle to make new highs. This shorter term 60 minute chart of the FTSE 100 shows the struggle to regain 7,000 points and testing the cloud.
DL
MyPortfolio - WEEK 29
by David Linton, Updata CEO, London - 24 May
After 29 weeks, my portfolio is up 18.3% after costs
A much better week outperforming the market significantly
Chg on week: S&P 500: +0.2%, FTSE 100: +1.0%, GBPUSD: -1.3% MyPortfolio: +2.9%
Feeling a bit happier having re-gigged my holdings. In hindsight, I probably held some stocks too long. The market doesn't look great now, so being a bit more defensive. Hopefully last week was the low point in my portfolio
DL
MyPortfolio - WEEK 27
by David Linton, Updata CEO, London - 10 May
After 27 weeks, my portfolio is up 17.6% after costs
I got my outperformance back this week with a small rise in markets and a steady dollar
Chg on week: S&P 500: +0.3%, FTSE 100: +0.1%, GBPUSD: 0.0% MyPortfolio: +1.3%
I sold one of my best performers the week before last as it fell off a cliff over two days. I was a bit influenced by my recent lower performance. Generally it is best to forget about stocks you have sold and move on, but sometimes it pays to know if you have done the right thing. I started to regret my decision a few days later, but looking again a week on the stock hasn't recovered. Most of the time it pays to sell when the optimised stop is breached.
DL
MyPortfolio - WEEK 25
by David Linton, Updata CEO, London - 3 May
After 26 weeks, my portfolio is up 16.2% after costs
I underperformed again this week mostly taken up in dealing costs realigning my portfolio
Chg on week: S&P 500: -0.4%, FTSE 100: +0.9%, GBPUSD: 0.0% MyPortfolio: -1.9%
I went on the hunt for better performers. The chart (below) of a very well known US tech stock came up in my scans for upside targets as it broke to new highs and then subsequently fell on the announcement of great results. Hopefully this is just a temporary setback, but it contributed to my underperformance this week.
DL
MyPortfolio - WEEK 25
by David Linton, Updata CEO, Dallas - 26 Apr
After 25 weeks, my portfolio is up 18.5% after costs
Markets had a better week but the dollar and India falling further hit my performance
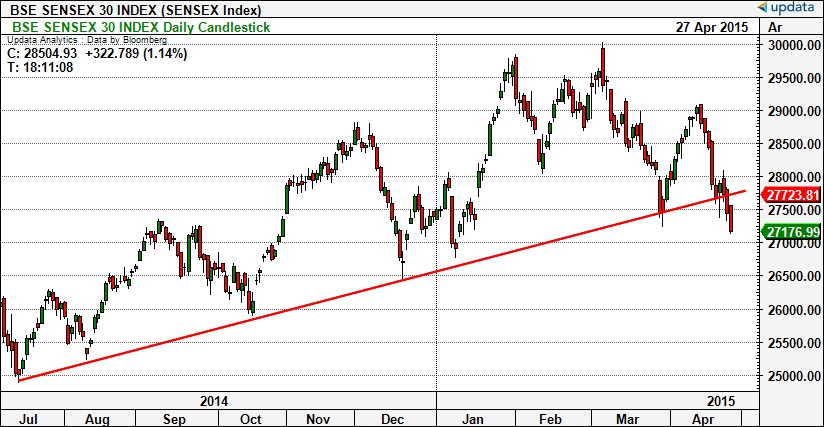
Chg on week: S&P 500: +1.7%, FTSE 100: +0.9%, Sensex: -1.5%, GBPUSD: +2.0% MyPortfolio: +0.5%
Markets had a better week, but i underperformed with exposure to India and the US dollar. I sold my holding in the Indian Investment Trust as a result. One cannot ignore the chart (below) for the Indian stock market.
DL
MyPortfolio - WEEK 24
by David Linton, Updata CEO, Dallas - 19 Apr
After 24 weeks, my portfolio is up 18% after costs
Markets had a poor week and I was hit with the dollar falling 2% and falls in India
Chg on week: S&P 500: -1.0%, FTSE 100: -1.3%, Sensex: -3.5%, GBPUSD: +2.0% MyPortfolio: -3.2%
UNot a great week with most of my stocks falling. My remit when I started this exercise was to always be fully invested on the basis that there will always be stocks that are going up. There will be challenging weeks and this was one of them. My exposure to India and the US dollar will need looking at next week.
DL
MyPortfolio - WEEK 23
by David Linton, Updata CEO, Dallas - 12 Apr
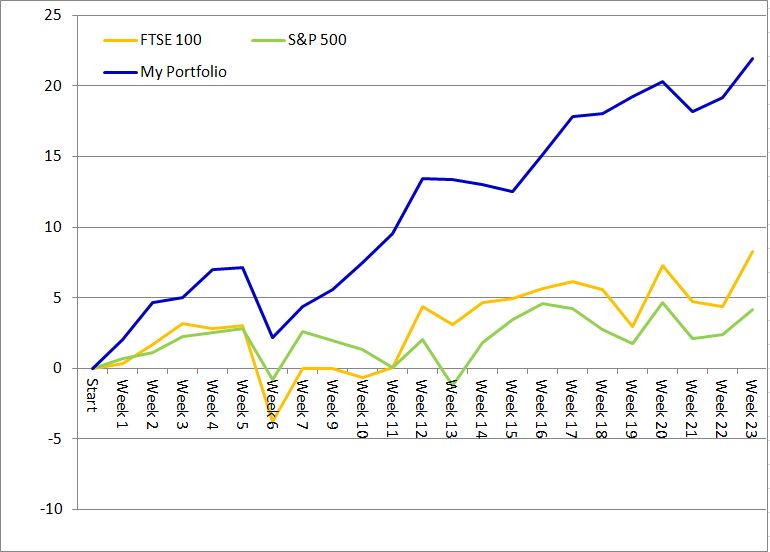
After 23 weeks, my portfolio is up 21.9% after costs
Markets had a strong week, especially in the UK with the FTSE 100 powering ahead 3.7%. Overall I was up 2.3%.
Chg on week: S&P 500: +1.7%, FTSE 100: -3.7%, Sensex: +2.3%, GBPUSD: -2.0% MyPortfolio: +2.3%
Underperforming the FTSE 100 was inevitable with many of the underperforming stocks in downtrends seeing sharp reversals. These were the strong performers in the week. For instance BG Group's jump on the Shell takeover news added 1% to the Footsie's performance with other stocks in the sector going up in sympathy adding more. The UK market is still heavily oil and gas laden.
Another feature in the week was Sterling falling to new lows in line with the big themes I set out several months ago. This helped my US stocks perform well in Sterling terms.
The portfolio is up 21.9% in 23 weeks, still not quite the 1% a week I am looking for, but close enough to get there. I may well swap out some underperformers this week in search of things that are more likely to jump.
DL
MyPortfolio - WEEK 22
by David Linton, Updata CEO, London - 6 Apr
After 22 weeks, my portfolio is up 19.2% after costs
Markets had a mixed week with the US down slightly and the UK up by a similar amount. Overall I was up 1%.
Chg on week: S&P 500: +0.3%, FTSE 100: -0.3%, Sensex: +0.2%, GBPUSD: +0.0% MyPortfolio: -1.0%
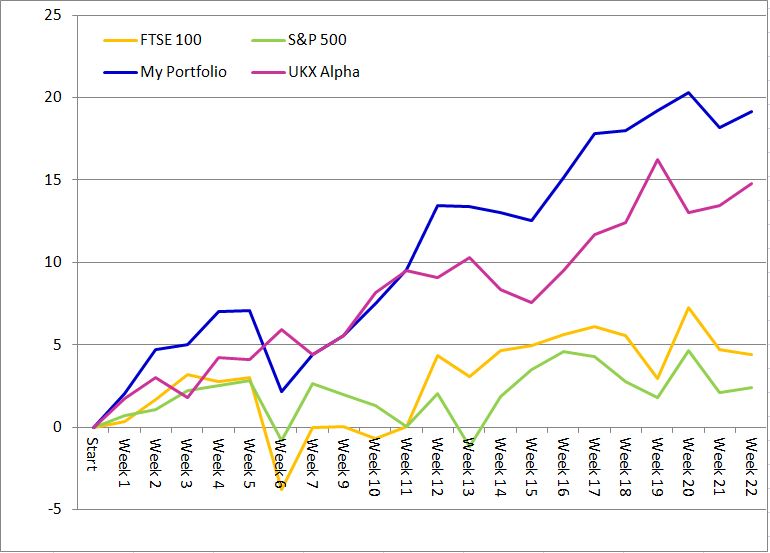
On thing I do keep an eye on is the Alpha of my portfolio - the amount I outperform the market by. When my holdings are running sideways in a rising market, that is effectively robbing my of Alpha. The purple line shows the Alpha of my fund of holdings running at just under 15%. I am up 19.2% and the market is up 4.4%, my Alpha being the difference between the two.
I would like to be performing even better than that but it needs to be remembered that dealing costs (which are not present in the market index increase) also have an effect on the portfolio return. None of my holdings is worrying me particularly at the moment, though with some more cash in my pension this week I am looking for another stock to add - probably in the US with signs that sterling will fall further still.
DL
MyPortfolio - WEEK 21
by David Linton, Updata CEO, London - 29 Mar
After 21 weeks, my portfolio is up 18.2% after costs
Markets had a bad week down around 2.5% and added to that Sterling was up 2% against the dollar robbing me similarly on any gains in my US stocks in my portfolio. Overall I was down 1.8%.
Chg on week: S&P 500: -2.5%, FTSE 100: -2.4%, Sensex: -4.0%, GBPUSD: +2.0% MyPortfolio: -1.8%
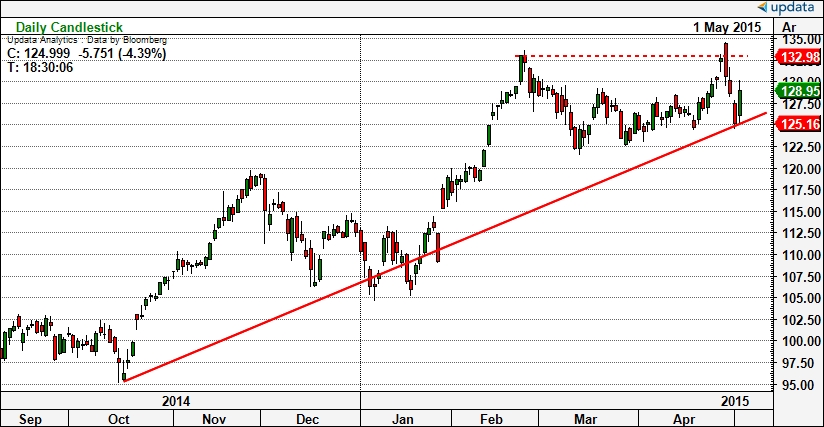
The big event was that one of my UK blue chip stocks fell 10% on the announcemant that a major shareholder had sold their stake. I didn't sell on this move. I find it is normally best to wait a day. But this did promt me to take a look at the on-balance volume chart for all my holdings. Here we see in the chart below how the OBV trend was diverging from the price trend. This highlights that there was more volume on the down days than on the up days. Distribution instead of accumulation. Cleaver selling over a large holding over a period of months. The OBV chart was not a sell signal in itself, but it has reminded me to keep a closer eye on these charts.
The real decision from here will be whether to sell as a reult of this move or to hold. A move below the £23 low would be a sell and a move above the £26 high would be a signal to run with it. But a decision may need to be made in between. The OBV will highlight whether we see strong buying and short term point and figure targets will help give directional clues as well. This stock is up over 30% since I bought it.
DL
MyPortfolio - WEEK 20
by David Linton, Updata CEO, London - 22 Mar
After 20 weeks, my portfolio is up 20.2% after costs
A strong week in the markets with the US up nearly 3% and the UK up 4%, but I faired less well with a 2% fall in the dollar on Friday and a poor performance in India over the week.
Chg on week: S&P 500: -+2.8%, FTSE 100: +4.2%, Sensex: -4.0%, GBPUSD: +2.0% MyPortfolio: +0.9%
When a set out on this exercise a few months ago, I set two main methodologies. The first was stock picking using point and figure charts and price targets. This involves scanning for stocks with the most upside potential and using the Ichimoku clouds to confirm trends on long, medium and short term time horizons. The second was monitoring with clouds and optimised stop losses in order to run trends and keep any losses small.
There were also three big ideas or themes underpinning the portfolio. These were:
- 1. The UK stock market looking set to break out and make multi-year highs
- 2. A strengthening US dollar making US stocks more attractive
- 3. The Indian stock market being the emerging market with the best long term P&F targets
Taking stock of these themes, the UK market has now broken out this week and this means that blue chip FTSE 100 stocks should perform strongly from here. The dollar had risen 8% against Sterling but has come back 2% this past week. The Indian stock market has under-performed in recent weeks even though the long term prospects still look good.
Two of my eleven holdings are Indian (UK listed) Investment Trusts. These have been going sideways for the past couple of months robbing my portfolio of some performance. So my aim in the coming week is to sell one of these and replace it with the best looking FTSE 100 stock to take advantage of the renewed run in the Footsie.
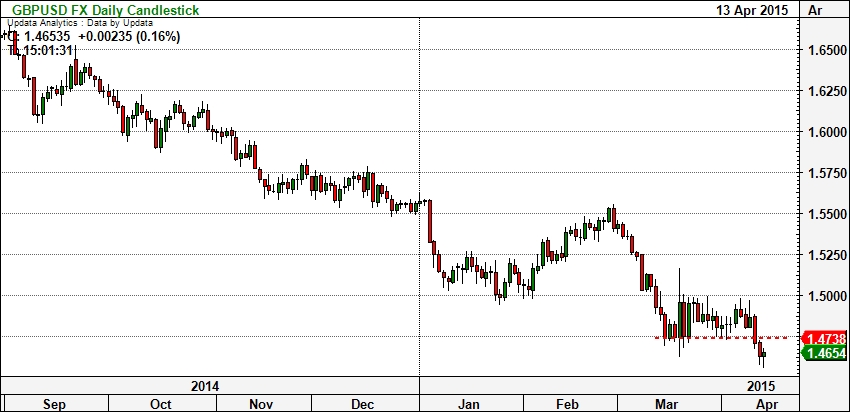
The bigger decision will be on the US dollar. The key question in the week will be whether the downtrend in Sterling is reversing or not. I will be watching the short term 60 minute GBPUSD chart for a sustained move above $1.50 for signs of a reversal in this trend. If this does happen, I will look at selling my worst looking US stock and buying the best looking FTSE 100 stock in order to adjust my weighting to the UK.
The medium term trend is still down and a move below the $1.4650 low we saw last week would confirm this. The most likely scenario is we will trade in the $1.4650 - $1.50 range for a little while in which case I won't make the adjustment.
DL
MyPortfolio - WEEK 19
by David Linton, Updata CEO, London - 15 Mar
After 19 weeks, my portfolio is up 19.2% after costs
A difficult week in the markets with the US down 1% and the UK down 2.5%, but I faired ok with my stocks holding their own and the US dollar strengthening significantly as predicted.
Chg on week: S&P 500: -1.0%, FTSE 100: -2.5%, Sensex: +0.0%, GBPUSD: -2.0% MyPortfolio: +1.0%
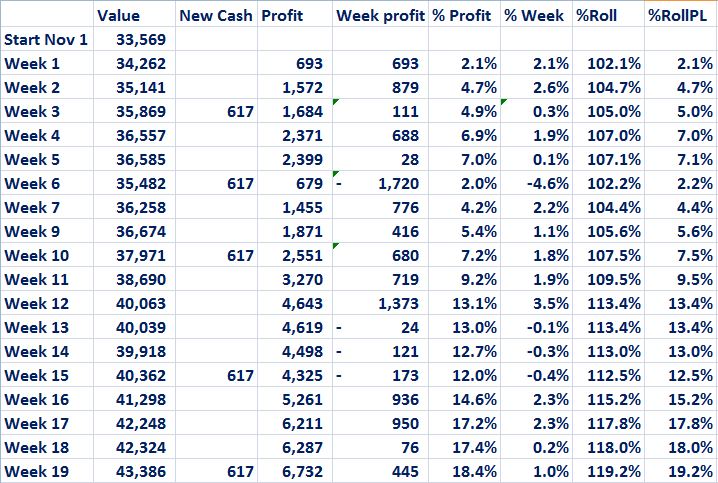
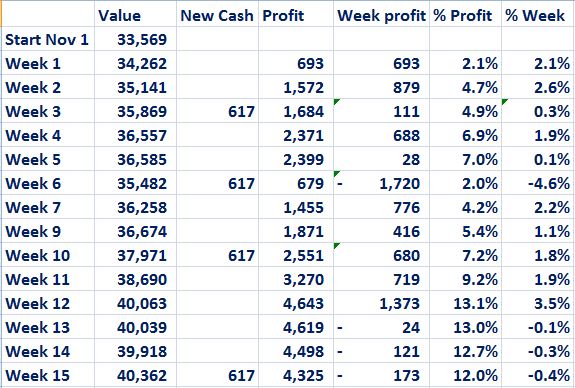
One thing I have been grappling with is how best to report my portfolio performance. If you start out with an amount and don't add any more funds the calculations are simple. Add in money along the way (which a pension plan or annual tax vehicle like and ISA encourages you to do) and the maths gets a lot more complex. Just Google time weighted or money rated returns and you will see this yourself. You need these formulas to calculate your true APR and I may well do this at the end of a year to truly show it.
This week another £617 was added and immediately my percentage return went down. My %Profit column adds this to the beginning amount although this money has just come in and not being deployed. A more representative way to calculate the return is the %RollPL column which just looks at the weekly return, with or without new money, and multiplies the previous week. This is how I will calculate the performance going forward.
DL
MyPortfolio - WEEK 18
by David Linton, Updata CEO, London - 8 Mar
After 18 weeks, my portfolio is up 17.4% after costs
Not a great week, but could have been worse
Chg on week: S&P 500: -1.4%, FTSE 100: +0.5%, Sensex: +0.8%, GBPUSD: -0.8% MyPortfolio: +0.2%
The US market feel away towards the end of the week and I sold three stocks as a result, one in the UK and two in the US. These were replaced right away. One of these jumped 4% on Friday (what I look for) and the other 2% after costs. Selling three stocks and buying three will have robbed me of some performance in the week with dealing costs.
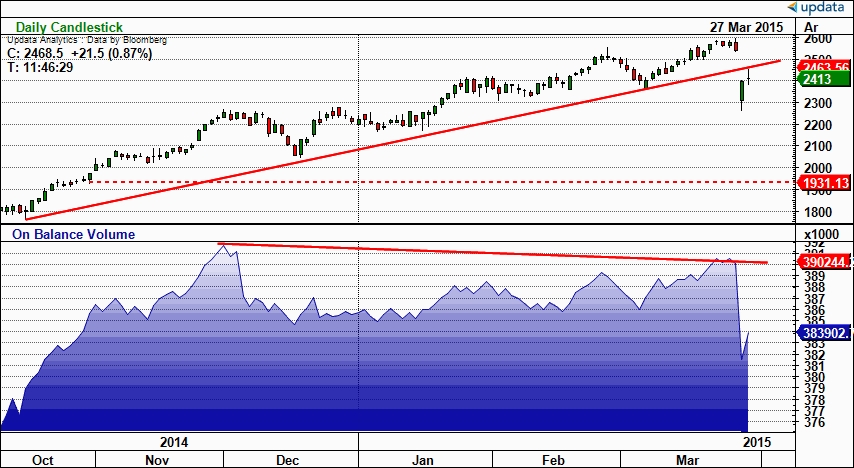
Perhaps the hardest decision was to sell my second best performer since starting out with this portfolio in early November. This stock (below) was up 30% in 4 months. I was starting to question the ideal holding period for stocks as per my research in the week. And I noticed the company was announcing results last Thursday. But the key thing was by Wednesday, they were two days through my stop. I generally wait a day on this and that was enough for me to make the decision to bank the 30% profit.
As it happened, the results were good and the stock jumped around 5% on Thursday after I sold. Do I regret this decision? First of all one or my replacement stocks was up 4.5% after costs on Friday, so I don't feel I have really lost out. But I couldn't resist looking at some other measures though none of these were part of my decision to sell. I know from experience, that volatility generally occurs at the end of a trend. A stock that was predictable became less so last week. It is also interesting to note that the On Balance Volume is not making new highs which is a sign of bearish divergence. The stock may go on to make new highs, but I know the optimised stoplosses have an 80% success rate, so I am not going to worry about it. Given what I have learned about holding periods, I might have got out a bit earlier with the 60 minute cloud.
DL
So what is the ideal holding period for stocks?
by David Linton, Updata CEO - 3 March 2015
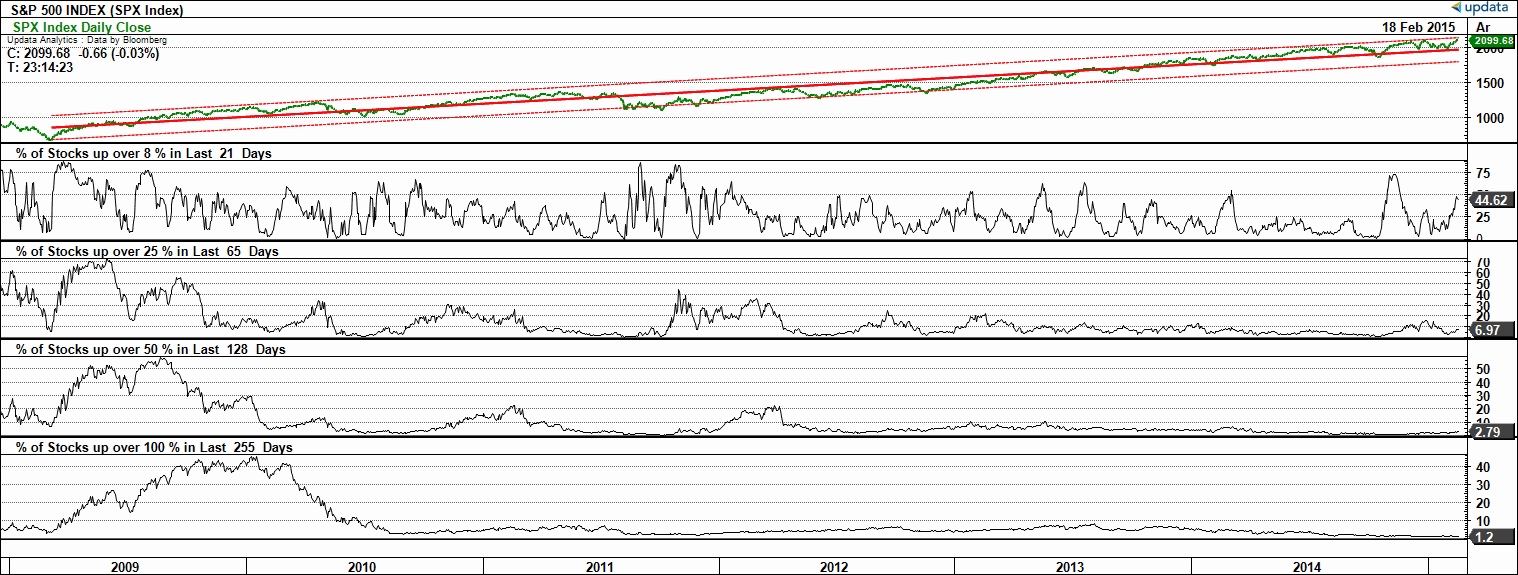
My objective with my portfolio is to aim double my money each year, so I was curious to understand the best holding period for stocks. So we developed a simple custom coded breadth indicator in Updata. What I am trying to establish is what is the best route statistically to doubling your money in stocks in a year. Is it buy and hold for 100% in a year, two trades at 50% in 6 months, four trades at 25% in 3 months, or 12 trades at 8% a month? In short, where is the sweet spot?
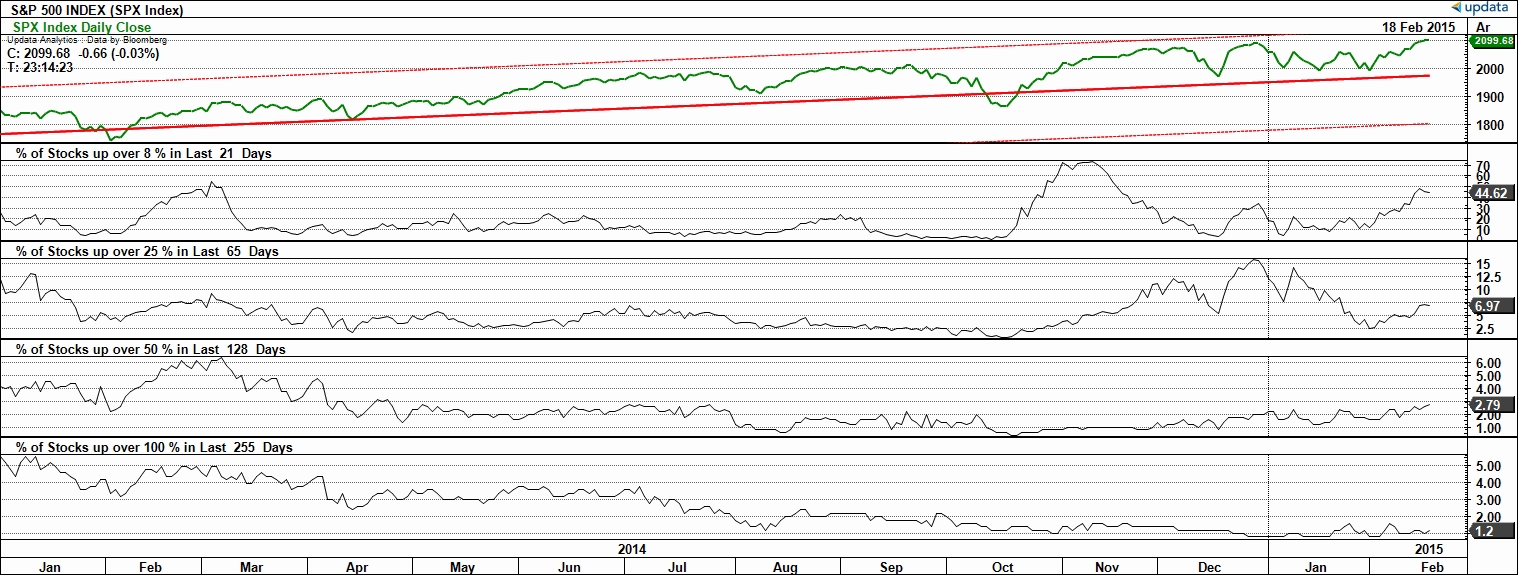
Looking at the S&P 500 stocks over the past 30 years we see the historical percentages of stocks returning these numbers on a rolling basis.
The number of stocks up 100% in a year is mostly below 10%, rarely above 20% with one unique period in 2009 where the break to an all time high on breadth grounds was probably a once in a generation opportunity. Right now only 1.2% of stocks have doubled in the past year, so on these breadth grounds the market may still be cheap or most stocks are languishing.
We see that stocks up 50% in 6 months rarely get above 30%, with 2.8% of stocks managing that currently. It doesn't follow historically that twice as many stocks go up 50% in 6 months than do the number up 100% in a year. Or, half the stocks that go up 50% in 6 months go on to 100% in the following 6 months.
The number of stocks up 25% in 3 months did frequently hit 40% and 50% pre 2009 and right now is at 7%. This is nearly 6 times more 100 percenters in a year and 2.5 times more than the 50s.
Lots of stocks go up 8% in a month historically and right now 45% of stocks have done that, over 7 times more than 25%'ers. But we also see the extreme volatility in this measure, showing that market timing is really key.
Zooming in to the uptrend of the last 6 years, we see this data a little more clearly. In the last 4 or 5 years, the number of stocks doubling in a year has been very low - never more than 1 in 10. Those up 50% in 6 months has been at 20% a couple of times, but this is also less than 1 in 10 mostly. Stocks up 25% a quarter has been up in the 30 and 40% area and interestingly the extreme readings on the 8% in a month indicator were a precursor to this. I take some encouragement from the recent 3 year high here.
And here we see it zoomed even more closely.
So, what to deduce from all this? I am running scans for stocks with upside targets greater than 50%. But if I am to get to doubling the value of my portfolio in a year, these indicators suggest that statistically I would be better off aiming for stocks going up 25% in 3 months than stocks rising 50% in half a year. Aiming for 8% a month is too short a time frame for me.
My portfolio is up 17% in 17 weeks and what I have been finding is a number of stocks do hit 25%, but getting above 30% return soon after seems to be a struggle. This is what prompted me to look at this. This indicator is in the Updata Custom Indicator Library under breadth, if you want to explore this idea yourself and for longer term holding periods you could look at running this on weekly charts.
DL
MyPortfolio - WEEK 17
by David Linton, Updata CEO, Washington DC - 28 Feb
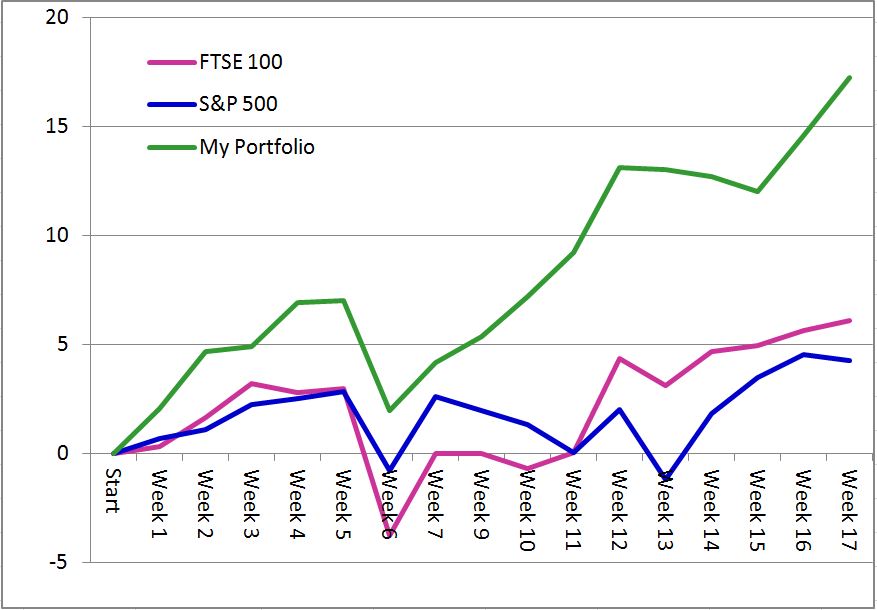
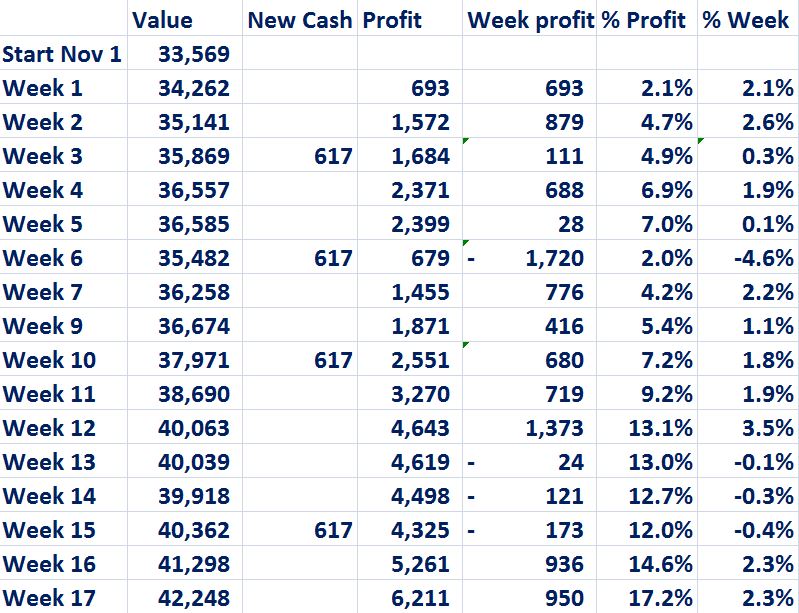
After 17 weeks, my portfolio is up 17.2% after costs
I outperformed this week with my portfolio up another 2.3%.
Chg on week: S&P 500: -0.3%, FTSE 100: +0.4%, Sensex: +0.0%, GBPUSD: 0% MyPortfolio: +2.3%
I didn't make any changes in the week and was pretty busy travelling on business in the US. My performance was helped with one UK company reporting better than expected profits and jumping 4% on the news and another US company reporting good results and jumping 13% on the news. This stock is now up over 40% since it came up in my scans a few months ago. Good news happens in uptrends!
My portfolio comprises 11 stocks all of which were selected from my point and figure scans for stocks with upside of more than 50%. See the video of how I do this at the start of this blog.
DL
MyPortfolio - WEEK 16
by David Linton, Updata CEO, New York - 22 Feb
After 16 weeks, my portfolio is up 14.6% after costs
I outperformed this week with my portfolio up another 2.3%. I did sell one US and one UK stock that were lagging. The UK one is still languishing, but the US one did jump several percent after my sale. However the new US stock I bought is also performing strongly. The new UK stock is up slightly, but looks set to run.
Chg on week: S&P 500: +1.0%, FTSE 100: +0.6%, Sensex: +0.5%, GBPUSD: 0% MyPortfolio: +2.3%
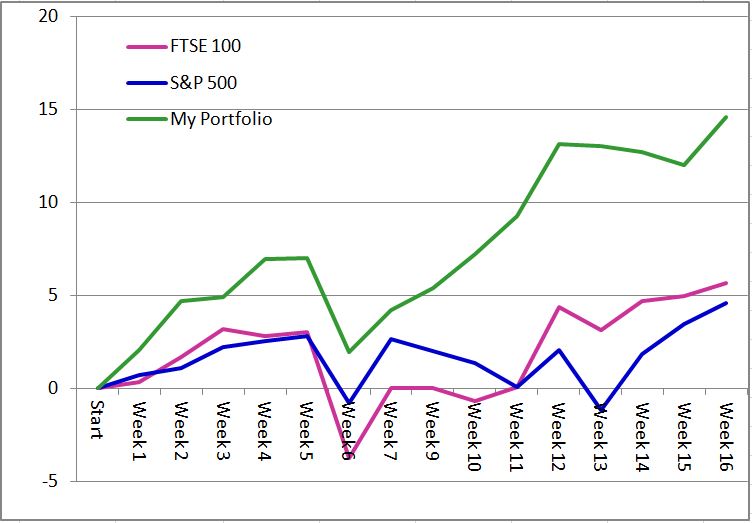
These stock selections are all made via the point and figure scanning in Updata. Here is how my current screen looks for monitoring my stocks in the coming week.
DL
MyPortfolio - WEEK 15
by David Linton, Updata CEO, Singapore - 15 Feb
After 15 weeks, my portfolio is up 12% after costs
My portfolio underperformed in the week mainly due to my Indian investment trusts being hit on Monday after last week's fall out in India, one of my US stocks coming out with lower than expected earnings and a stronger pound against the dollar reducing some of my US performance.
Chg on week: S&P 500: +1.6%, FTSE 100: +0.3%, Sensex: +1.3%, GBPUSD: +1.3% MyPortfolio: -0.4%
Also my performance was understated by my regular monthly payment into my pension. Here we see how my week on week performance was -0.4%, but because of £617 of new money coming in, my performance over 15 weeks is reduced by 0.7%./p>
I didn't make any new trades in the week as per last week. None of the stocks in my portfolio look especially worrying, but my lowest performing stocks, one UK and one US stock, although they are recent purchases should be performing better by now. I may well sell these and run the scans again for stocks that look more poised to jump in price.
DL
MyPortfolio - WEEK 14
by David Linton, Updata CEO, Singapore - 8 Feb
After 14 weeks, my portfolio is up 12.7% after costs
Stock markets recovered in the week, but my portfolio underperformed mostly because the US dollar fell robbing me of just under 1% on the week and India fell as well pulling my investment trusts back.
Chg on week: S&P 500: +3.06%, FTSE 100: +1.53%, Sensex: -1.59%, GBPUSD: 1.33% MyPortfolio: -0.3%

I said that all my stocks looked OK a week ago. The screen above is what I typically look at to monitor them. Top row left to right is the S&P 500 Index, then my two Indian investment trusts and the one UK stock I have held from the start of November. The second row is a UK brewer, a UK software company and an airline. The last on the right on the second row is my best performing stock, a US grocery chain up over 32% since the start of Nov. The last row are all US stocks, a beverage company, a medical devices company, a games company and an oil refiner - respectively.
The red dotted lines indicate where I bought and the stoplosses (S key on your Updata system) I use are red (optimsed - shorter term) and blue (best fit - longer term) and I make my monitoring and selling decisions around these. None of my stocks looked terribly worrying in the week, so there were no trades, but this is the screen I take a look at most days.
DL
MyPortfolio - WEEK 13
by David Linton, Updata CEO, London - 1 Feb
After 13 weeks, my portfolio is up 13.0% after costs
A difficult week in stock markets with the US market off over 3% taking it to it's lowest level since I started this portfolio. My portfolio was down by only 0.1% on the week which I am relatively happy with.
Chg on week: S&P 500: -3.16%, FTSE 100: -1.2%, Sensex: +1.38%, GBPUSD: 0.0% MyPortfolio: -0.1%

I said that all my stocks looked OK a week ago but as the week progressed one of my US holdings did start to look like it was coming off the top. I decided to lock in the 5% profit on this stock and not risk seeing it eroded. I wasn't so motivated by taking a profit, it was more that the chart was starting to look less good.
I ran my scan and the best looking stock out of my shortlist was a US oil refiner. Even though oil is a dirty word at the moment (though see my Charts this Week recording on crude and seasonality) there is no denying this stock looks great technically, so I bought it.
Hopefully we will have a better week in markets this coming week and my portfolio can truly start to outperform.
I am up 13% in the first quarter. If I can achieve this over the next three quarters I will by up 63% on the year.
DL
MyPortfolio - WEEK 12
by David Linton, Updata CEO, Houston - 25 Jan
After 12 weeks, my portfolio is up 13.1% after costs
Markets had a strong week and I am now up 13.1% over 12 weeks. Since the start of November, I am up 13.1% after dealing costs and stamp duty on UK purchases, while the S&P 500 and the FTSE 100 are up around 2% and 4% respectively.
Chg on week: S&P 500: +1.98%, FTSE 100: +4.29%, Sensex: +2.36%, GBPUSD: -0.66% MyPortfolio: +3.5%

Last week, I said that one of my US holdings was worrying me slightly and by Tuesday I decided that I would sell it and buy something that had a higher chance of performing. The stock I sold jumped 6% on Friday, but then the stock I replaced it with is up 4%, so I am not going to beat myself up about it. Of course, I ran my 1% point and figure scans as normal and chose the best looking replacement out of around 15 stocks. Interestingly, after this week's move in the market, there are around 60 stocks with 10% upside. A good proxy for further rises.
One of my UK stocks that I had high hopes for was concerning me as the price was deteriorating gradually. Of the eleven stocks I had bought at the beginning of November, this was the only one that was not up over 20%. That is what they are meant to do. I am buying 50% upside. So I decided to lock in the 6% profit and find something better on Wednesday. In this instance the one I sold has fallen a few percent and the one I bought has risen by 5%. So this switch I did get right. Again this was the best looking chart out of a handful that came up in my point and figure scan of the FTSE 350 constituents. There are now 29 UK stocks in uptrends with over 50% upside based on this scan in the FTSE 350 list.

From the start, I have run this as a process that people could follow if they wanted. I started with a nominal sum of UK £33,569 (around US $50,000) which I considered to be a level of savings that many people could find. I set out my objectives in my very first blog 12 weeks ago. Underpinning this, I outlined 3 big themes which were clear in the charts:
- The US dollar would strength - up 6.25% against sterling so far
- India was the emerging market with the best upside targets
- The UK market had upside targets taking it new highs - a 15 year breakout
So I bought 4 UK stocks, 4 US stocks and 2 Indian Investment trusts (UK listed - US ETFs or funds were the alternative). These stocks were chosen entirely on their technical criteria from point and figure scans run in the Updata software (stocks in uptrends with over 50% upside price targets) as described in my first blog. Of those initial 11 purchases, 5 have gone up over 20%. The challenge of these 5 holdings will be to lock in the profit at the highest level. Not sell too soon and not hold on too long. That's where Updata's optimised stoplosses come in.
So 6 holdings were sold since the start and these are now mostly flat or down a little from where I sold. A further 3 were bought and subsequently. Mostly small losses were made. In fact overall it amounts to around £300. The discrepancy in screen shot above (valuation of only current holdings broker screen) and spreadsheet below which reflects all trades. Around £300 in transaction charges and taxes are also taken into account.
I am running this as one of my UK pension funds partly as an experiment to show what can be achieved using Updata. And to mimic what others might do, I am making some contributions each month toped up with the tax relief under the salary sacrifice scheme. So this does in fact make the percentage return calculation over a given time period difficult ad the money invested is changing during that time. This is a bit clearer in the spreadsheet below. The return is 13.1% on all cash invested, some of it only 2 weeks ago, not 12. So the annualised number should improve if I can maintain the performance. It is also worth noting that 3.5% improvement this last week is actually 3.9% on money invested (13.1-9.2) and this power of compounding should improve over time.

Overall I have bought 20 stocks and sold 9 of them. Started with 11, sold 6, bought 6 and sold 3 of those stocks and sold another 3. After the start, this equates to 3 stocks a month sold with 3 replacement stocks bought. Mostly I review my stocks once a week and end up having one that I am worried about and then keep a closer eye on that one and often end up selling it. I could be more patient, but I am trying to maximise my performance without over-trading. I don't really have the time to watch it more closely and worry about more than one stock a week.
I have made some small mistakes and I will cover these next week when I review my first quarter of this exercise. This week there isn't any one chart in my eleven holdings that worries me and that in itself is a little bit worrying.
If you want to follow me, download the software, watch the videos and read my past weekly blog!
DL
MyPortfolio - WEEK 11
by David Linton, Updata CEO, Houston - 18 Jan
After 11 weeks, my portfolio is up 9.2% after costs
Markets had a very mixed week. My stocks put in a pretty good performance at 1.9% on the week and out-performance of 3.2% on the S&P 500 Index. Since the start of November, I am up 9.2% after dealing costs and stamp duty on UK purchases, while the S&P 500 and the FTSE 100 are both unchanged.
Chg on week: S&P 500: -1.27%, FTSE 100: +0.06%, Sensex: +2.41%, GBPUSD: -0.66% MyPortfolio: +1.9%

I said that one of my US holdings was worrying me slightly last week. It did improve slightly on the week, but the chart is still the worst looking one of all my holdings. Again I will keep a close eye on this in the coming week.
DL
MyPortfolio - WEEK 10
by David Linton, Updata CEO, Houston - 11 Jan
After 10 weeks, my portfolio is up 7.2% after costs
Markets had a mixed week. My stocks put in a pretty good performance at 1.8% on the week and out-performance of 2.5%. Since the start of November, I am up 7.2% after dealing costs and stamp duty on UK purchases, while the S&P 500 is up 1.3% and the FTSE 100 is down 0.7% in that time.
Chg on 2 weeks: S&P 500: -0.63%, FTSE 100: -0.70%, Sensex: -1.54%,

said last week that one of my US stocks was worrying me. I sold this on Monday and although it did recover a bit in the week, the new stock that came out of my point and figure scans on the US market did much better, jumping 5% the day after I bought it. This stock is now making a 7 year high which is a very strong sign from a technical analysis perspective.
Also in the week, one of my UK stocks (a house-builder) was starting to worry me. On Tuesday it broke the standard uptrend. It stayed there on Wednesday and on Thursday morning it was moving lower. I was showing a 6% profit on the position since November and with the chart looking more worrying I decided to sell at 1,527p. Just as well because the next day the UK house-builders fell dramatically and the shares closed at 1,459p as per the chart below. Bad news often follows a break of the trend, but I felt lucky to be out all the same. My 6% would have been wiped out which would equate to about 0.5% of my overall portfolio performance.

As soon as I sold this shares, I ran a scan of the FTSE 350 for stocks with over 50% upside on the 1% point and figure targets and only two shares came up in the scan. I bought the better looking chart of the two (a software company) and noted that the consensus broker forecasts was not particularly positive, not that such things matter to a technician.
Hopefully this coming week will be a better week. One of my US holdings still worries me slightly, so I will keep a closer eye on that.
DL
MyPortfolio - WEEK 9
by David Linton, Updata CEO, Houston - 5 Jan
After 9 weeks, my portfolio is up 5.4% after costs
The market did bounce back towards the week recovering most of last week's loses. My portfolio performance wasn't great. India underperformed UK and US, but I am confident that overall the stocks I have all look poised to start doing well again.
Chg on 2 weeks: S&P 500: -0.63%, FTSE 100: +0.3%, Sensex: +1.89%, GBPUSD: -2.56% MyPortfolio: +1.1%

I said that one of my US holdings was worrying me slightly last week. It did improve slightly on the week, but the chart is still the worst looking one of all my holdings. Again I will keep a close eye on this in the coming week.
DL
MyPortfolio - WEEK 7
by David Linton, Updata CEO, Houston - 21 Dec
After 7 weeks, my portfolio is up 7.0% after costs
The market did bounce back towards the week recovering most of last week's loses. My portfolio performance wasn't great. India underperformed UK and US, but I am confident that overall the stocks I have all look poised to start doing well again.
Chg on week: S&P 500: +3.45%, FTSE 100: +3.89%, Sensex: +0.1%, GBPUSD: -0.1% MyPortfolio: +2.2%

The screen below shows how I monitor the portfolio. Most stocks tested their stops, I tend to use the longer term blue stops and the red the shorter term red as a warning. One of my most recent purchases in the bottom right corner is the one I will be keeping a closer eye on. But realistically I won't be giving my portfolio much attention over the festive season.
DL

MyPortfolio - WEEK 6
by David Linton, Updata CEO, Houston - 15 Dec
After 6 weeks, my portfolio is up 2% after costs
A very tough week in the market. The FTSE 100 was down 6.6% it's biggest weekly fall in over three years. This is unusual in December, normally a very good month for equities. It wasn't helped by the fact that I was away for the first few days of the week, although my remit is to not sit and watch a screen all day anyway. I had been concerned about two stocks (one UK, one US) in my portfolio as highlighted last week and they were looking no better on Monday so I decided to sell them. Given my aim is to be in the market and not in cash, I was looking for replacements on Monday evening (outlined below).
By Thursday, a third stock (US) was falling to worrying levels and I decided to sell booking a 5.1% profit while it was still there. This was replaced with a now better looking stock I had already owned a few weeks ago which was looking good again. I managed to buy in at a lower price than I sold at. The US and India didn't perform quite as badly, but a slight improvement in to dollar also didn't help. And with 3 sells and 3 buys in the week there were dealing costs and stamp duty. I am sure this rout will be short lived and the market will bounce back next week and after as we head into the stronger seasonal period.
Chg on week: S&P 500: -3.52%, FTSE 100: -6.6%, Sensex: -3.1%, GBPUSD: +0.7% MyPortfolio: -4.6%

The screen below shows some results from running my scan on the FTSE 350. There were 21 stocks with more than 50% upside on the daily 1% P&F charts. The 6 charts showing here were the best looking. On Tuesday when the market opened I went for the one in the middle bottom.

The screen below shows the same process for finding the replacement US stock. Again the middle bottom chart was the one I chose.

The screen below shows the third replacement stock I decided to buy in the week. With the market falling so heavily I decided to take a close look at the 60 minute charts for timing (RH charts). I was persuaded by the cloud cross and the short term P&F target. This was the stock I had sold a couple of weeks ago at higher levels.
DL
MyPortfolio - WEEK 5
by David Linton, Updata CEO, Houston - 7 Dec
My portfolio didn't perform so well on the week up only 0.1%. I have been away the last few days, so not monitoring my positions as close as I might have normally. See comments on monitoring my positions below.
Chg on week: S&P 500: +0.29%, FTSE 100: +0.21%, Sensex: -1.67%, GBPUSD: 0% MyPortfolio: +0.1%

The screen below shows how I monitor the portfolio. The tell tales I look for is my trailing stops flat-lining. Last week I said the right two stocks in the middle row was where I had concerns. The first one is a UK stock which I will sell today as a result of the price hanging below my trailing stoploss for too many days now. The second one is a US stock which I will look to sell as well. Then I will run my scan process for two replacement stocks.
DL

MyPortfolio - WEEK 4
by David Linton, Updata CEO, London - 28 Nov
In the first month, my portfolio is up 6.9% after costs
So here is my portfolio after the forth week. Up 6.9% overall, 1.9% on the week. So I have 5 stocks up over 10% and another 4 up over 5%. The last 2 stocks, I bought only last week, so they are yet to get going. It was also Thanksgiving in the US this week, so it was a bit quiet. As I said in my opening week, I need at least 6% a month return to reach my objective of doubling my money in the year. I only sold 2 stocks and bought 2 replacements in the month. See comments on monitoring my positions below.
Chg on week: S&P 500: +0.29%, FTSE 100: -0.4%, Sensex: +1.27%, GBPUSD: -0.64% MyPortfolio: +1.9%

The screen below shows how I monitor the portfolio. The tell tales I look for is my trailing stops flat-lining. The right two stocks in the middle row I have slight concerns over. These will be my two to keep a closer eye on next week.
I also did a quick check of the market for any short term sell off. Not too worried for the coming week....DL

MyPortfolio - WEEK 3
by David Linton, Updata CEO, London - 22 Nov
In the first month, my portfolio is up 4.9% after costs
So not as good this week. I actually sold two holdings in the week. One which wasn't performing and decided to swap to something better looking and one that fell quite sharply that I decided to swap as well. I will explain what I did in more detail below.
Chg on week: S&P 500: +1.1%, FTSE 100: +3.2%, Sensex: +1.7%,

Now my portfolio screen says that I am up 6.18% on my investments. This is true, but it doesn't take account of the losses I made on the two sold holdings in the week - 2.8% and 9.3% respectively. My general rule is that I don't really trade intra-day. I see where a holding closes and make a decision on the next day. I also run a scan (or look at my recent scan lists) and then reinvest into the one of these that looks best or hasn't moved too much that day.
There are a couple of points here. First is I am taking losses first, ie I haven't sold any profitable holdings yet. they are still running up. This means the percentage performance (6.18%) doesn't take account of the two losses, so it overstates the profit. It is just the return on the current holdings. Conversely when a profitable stock is sold, the performance percentage with then be understated. The other point is that the holdings that are down (red above) this week are the new purchases. With commission and the buy/sell spread, you start from a negative position. I probably could have timed the purchase of US Stock 1 better with some intra-day analysis, but I was a bit short of time. The daily chart looks great (see further below), I am not too worried about it. So my true portfolio performance is shown below.

The other factor that makes measuring time based performance more difficult is the introduction of new cash into the portfolio. As I am running a UK pension, the tax incentives to put some salary payments in is high. And I will probably add some lump sums along the way. So the 617 payment is shown in the week it is invested. On the sale of my first holding, I topped up the next purchase by around the extra cash, rather than wait for a few months cash to accrue for the next holding. I am expecting to go from 11 to 12 holdings when I sell a very profitable one - ie split the proceeds into 2 new holdings. So the profit numbers this week all reflect the introduction of £617 as well (ie 35,869-33,569-617=1,684).
The first sale
So the screen I normally look at each day is the one at the end of last week's blog. This is my portfolio visually at a glance. I said that one of my holdings was worrying me, as the stoploss was flatlining. On Wednesday I noticed it was starting to fall so I took a closer look with the screen below. The point and figure targets from my original scan a couple of weeks ago were still valid, but both the 1% and 0.5% charts seemed to have hit some resistance. The daily cloud chart (top right) was still bullish above the cloud but the price was slowly falling. Looking at this chart, we also see a resistance level set back in May was being hit. The red chart in the bottom window is the On Balance Volume chart and I just wanted to check that wasn't rising (ie: more volume on up days than down days). The 60 minute cloud chart in the bottom right of the screen showed that this stock had moved below the cloud and was turning short term bearish. The new lows here pushed me to sell the shares with a 2.8% loss. I am convinced I could find a better looking chart now and make that back up. I rarely look back at holdings I have sold, but had I held the shares to the end of the week I would have been showing a loss of 6.7%.

Finding a replacement

From last week's blog, my two top performers were US stocks. here I am gaining a small advantage of a rising dollar but US stocks seem to be rising a bit faster. So I decided to replace the UK stock sold with a US one. So I ran a scan on the Nasdaq 100 constituents looking for stocks that had broken out with 50% upside and in uptrends. See my first blog for details. It took a minute to come back with 12 stocks meeting the criteria and I scrolled the charts. The one below was my favourite one. Good upside targets and breaking to a new high. I bought it and now have high hopes for it.
The second sale
The second sale of the week was a bit harder. The stock in the bottom left had corner had fallen quite heavily on Thursday. I am not interested in why it happened. All that mattered was what would do the following day.

So, on the Friday opening, the price opened up but the 60 minute chart was starting worry me with a big downside target and the stock starting to fall to a lower level than the previous day's low. This was now not looking like a recovery. I sold at $141.70 and the stock fell to $137.50 before recovering to close at $140.37. I am pleased I sold.

I normally might have waited a day, but I wanted to end the week fully invested. So I went on the hunt for a replacement stock. My scan for stocks with 50% upside in the Nasdaq 100 was not producing any charts that looked as good as the one I bought two days ago. So I had some choices:
- Accept a less good looking chart
- Scan for less upside - say 30 or 40%
- Scan a bigger universe of stocks
I decided to scan a larger universe and chose the S&P 500 Index. Five times as many stocks took a few minutes longer, but produced many more candidates. In the end I chose the chart on the right. A very large US stock with good upside potential.

Hopefully next week will be a better week.
DL
MyPortfolio - WEEK 2
by David Linton, Updata CEO, London - 15 Nov
In the first 2 weeks, my portfolio is up 4.68% after costs
So here is my portfolio after the second week. Up 4.68% overall. My top 2 performers are in the US. Both Indian trusts are doing well at around 6% up. UK is mixed with one poor performer, but it is still early days. See comments on my monitoring screen below.
Chg on week: S&P 500: +0.39%, FTSE 100: +1.32%, Sensex: +0.65%, /p>

The screen below shows how I monitor my portfolio. One of the tell tales is are my trailing stops rising up as the price makes new highs. The first two charts are my Indian funds and the bottom 4 are my US stocks. Where the stop is flat-lining I have slight concerns. The third from right chart in the middle row is my worst performer and I have made a note to keep a closer eye on this stock this week.
I also did a quick check of the market for any short term sell off. Not too worried for the coming week....DL

MyPortfolio - WEEK 1
by David Linton, Updata CEO, London - 8 Nov
In the first 2 weeks, my portfolio is up 2.06% after costs
So here is my portfolio after the first week. Up 2.06% overall. The UK stocks and Indian trusts have 0.5% stamp duty in the purchase cost, plus commission and the difference between the bid/offer spread - means that the first week is the hardest as you start from a negative position right away.
The stats in green below are the % change on the week for my key market measures. This helps me see if it is me or the market. Even turkeys can fly in a strong wind. Lets see what next week brings....DL
Chg on week: S&P 500: +0.69%, FTSE 100: +0.32%, Sensex: +0.01%, /p>

MyPortfolio - The Start
by David Linton, Updata CEO, Chicago IL - 2 Nov 2014
Last week, I decided to embark on a stock trading experiment. It wasn't a snap decision. It has been on my mind for a while. I had £32,978 ($50,000) languishing in a conservatively run pension which I could use for a test portfolio.
I have written books on investment, and I run Updata which produces probably the best technical analysis software in the world. OK, I am biased. Many of the biggest global financial institutions rely on our software for their investment decisions. We have clients in over 60 countries and I have trained thousands of traders in over a third of them. I am busy. Last year I flew the equivalent of London-New York 42 times with a punishing global travel schedule.
So there is a central question that I have been asked time and time again over the years; 'If you're so good and Updata is such great software, why haven't you made a fortune doing this?' I have palmed this off with the answer that it is difficult to trade on planes and different time zones, but in reality that is a cop out. I accept that I may not be 'so good', but Updata is more than just good software. It's amazing! And this exercise for me is as much about proving that fact as it is about the money I intend to make with others potentially doing the same in the process.
Talking to traders and investors is difficult. They are an impatient bunch and generally don't want to do the work and make the decisions themselves. I know, I have met thousands over 25 years in the business. I am bombarded with; 'Explain that technique (from a book of 700 pages) in a minute. Just tell me what I should buy?' etc. This has been a barrier to sharing knowledge. There are also regulatory implications in making stock recommendations and even if I could legally tell you every stock I am buying and selling, the chances of the same set of conditions lining up are low (ie: I sold a holding and need to reinvest or the stocks I hold now have less upside etc). On top of this, the overhead of explaining takes hours. Much longer than the process itself.
So, I am not going to tell you the stocks I am buying. Please don't ask. If you want to be a pure follower, buy a fund where someone else does all the work. What I am going to do each week is share my methodology and my performance (screenshots of my portfolio each week). My objective is to try and double the size of my portfolio in a year. I may not achieve this, but that's my target.
Knowledge
If you want to actually try and do this yourself, my recommendation is that you start slowly and practice with a ghost portfolio first. Not real money. You will need to get practice and build knowledge before investing your own money first. This learning program can be intensive over a week or so, or more slowly over weeks and months. The choice is yours. On my training courses, traders often ask me in the first 20 minutes 'So how do I trade that?' The course is an intensive 7 sessions over a day and my answer is always 'we are not equipped yet.'
The methodology I will use for my portfolio relies on 3 techniques that are also part of the Updata software:
- Point and Figure charts - when and what to buy
- Cloud Charts (Ichimoku) - what is the trend state
- Optimised Stoplosses - when to sell
To follow and understand these techniques, I recommend the following 3 areas of study:
- 1 - Watch my online training videos (free)
You also need to get a good grounding in basic technical analysis techniques such as: Dow Theory, Indicators and other tools. I recommend a good starting point is my training course for professional energy traders which was recorded last year. It doesn't cover individual stocks but it will give you a good grounding and build up to the three techniques I am using above. Many firms have paid thousands to put their trading teams through this course. You can watch it for free - HERE - 2 - Get a good understanding of point and figure charts
I strongly recommend that you read the 'Definitive Guide to Point and Figure' by Jeremy du Plessis. It is THE book on the subject and you can order it direct from the publishers in the UK - HERE If you are outside the UK, you can find it on Amazon. You will see it has great reviews. - 3 - Start practicing on your computer
Take a free trial of the Updata software to follow both the video course and the book. I will share more and more each week along the way. You can get a free trial and follow me - HERE
Trading style
This is another area where all traders and investors are different. My working week is generally hectic and often in another time zone from market hours which doesn't give me the time to watch markets and trade each day. At best I may manage to sell on an alert I have set sometime in the day. I am likely to only be in a position to make buying decisions on a weekly basis. My target is to double my money in a year - roughly 2% a week flat or 1.35% compounded week on week. So the simple solution would be to find a group of stocks that are set to double, buy them and forget about them. The problem is, as we will come to see when we run the scans for price targets, that these sort of stocks are few and far between. Targets this high may be improbable and less likely to succeed. There are many more stocks with 50% upside and even more with 30% and 40%, lots with 20% and loads and loads with 10% upside.
Week on week performance is probably unrealistic (though I will be looking for around 2% flat increase each week), so let's consider longer time frames. To double your money in a year, you need a monthly performance of 6% compounded, 13% bi-monthly, a quarterly performance of 19% or a 6 monthly performance of 42%. In reality compounding will apply more to shorter term active traders, but we all know the power of compound interest. As you increase the pot, the target gets easier. The value of these numbers is to understand what upside is needed to hit an annual target. If you are happy with a lower target, scanning for less upside will produce more stocks to choose from. Of course these percentages are all after buy/sell spreads, commission and taxes.
This will mostly come down to time pressures and the amount of stress you want in the process. My ideal holding period would be somewhere between 3 and 6 months reviewing progress weekly along the way. So I will be looking for stocks with 50% upside, but I may need to scan for stocks with 30% or 40% to get results. If you sit at home all day and want to be glued to the screen you could decide to trade more actively or use 60 minute charts instead of daily or smaller box sizes. If you don't know what 'box sizes' means, you are not equipped yet. Take the 3 knowledge steps! It is hard to say what is optimum and there will always be new more attractive stocks every day than the ones you hold. In the end it is up to you.
Time Horizon
Wherever I go, be it on trading floors or meeting investors at conferences I am always asked what I think of this or that. Generally, I don't store the charts in my head. I leave that to the computer. So I am fairly useless without the chart. But before I even look at the chart I have to ask the question 'What's your time horizon?' The main reason I have to ask this question is so I know what chart to look at - say a 60 minute, a daily or a weekly chart. The table below is my guide.

Source: Linton's Trading Time Horizon Table - page 150, Cloud Charts
Part of my methodology will rely on trend state across different time horizons. If you watch my training course, this will all fall into place by the time you get to the Cloud Charts module. I tend to focus somewhere between the medium and long term - weeks to months. having knowledge of both trends will be essential in my strategy.
Risk
There are four main factors that I will be looking at here:
- No less than 10 holdings - 15 or 20 in time would probably be more ideal
- No more than 10% stoploss (volatility) - optimised and trailing
- Trend state and market conditions
- Investing across more than one theme
Trading costs have a bigger effect on smaller amounts, so in my case £3K is my ideal holding size. I would rather it was £5K, but 6 holdings doesn't give me enough spread of risk (eggs in baskets). Equally, if you only have a total of £10K to play with, 3 holdings is too risky. You will have to suffer higher percentage costs to begin with on more smaller sized holdings.
The stoplosses are essential. Losing no more than 10% on one of your ten holdings (and this will almost certainly happen at some point) will have a small overall impact on your portfolio performance. See my online course on Optimised Exit Strategies. These stoplosses will become your sure fire way of monitoring your holdings each week. I will share my screen with you each week so you get the hang of it.
Trend state for individual stocks and the underlying stock markets, is something I will also consider each week and share with you when we look at how the buying and selling decisions are made.
Investment themes
As an extra spread of risk I have decided on three core themes for my portfolio. These work for me as I am UK based and may not be suitable if you are in the US or somewhere else in the world. Factors in your own markets and currency can have a big effect. You may come up with your own themes but here are mine:
- The US stock market has broken to new all time highs and is outperforming the UK market. The US dollar is rising against sterling which means US stocks could perform even better for UK investors
- The UK stock market, hasn't yet broken to new all time highs but will hopefully follow the US and then start to make up for 15 years of sideways.
- Emerging markets haven't looked great, but one market with good upside point and figure targets is India. This market is difficult for foreign investors, so here I will be looking at investment trusts. Funds and ETFs may also be possibilities.
My analysis of each of these markets will follow. Now, some UK investors may not want to trade US stocks. US investors would probably not consider the UK with currency risk and stamp duty of 0.5%. If I was an Indian investor, I would be running scans on the Indian stock market. Residents in other countries would probably want to scan the universe of stocks in that country.
Now we are starting to see the complexities of following me exactly:
- You will have a different starting amount
- You will have different time horizons
- You will have different time constraints
- You may have a different overall target
- You may be in a different country and have different currencies and taxes
- You may want to set different investment themes
- Most of all - different scans at different times on different days will produce different results
It is the methodology that truly counts!
Tax
I am trading in the UK, where the big tax incentives for investors are either a Self Invested Pension Scheme (SIPP) or ISAs. Each comes with its own set of advantages which you will need to explore with regard to your own circumstances. I am using a SIPP where I can trade online, but it could as easily be done in ISA across a number of tax years. In the US it might be a 401K and different again in other countries. UK shares also attract a 0.5% stamp duty for purchases over £1,000. And if tax wrappers are not used or trading occurs in other jurisdictions, gains may be taxable. If you are not sure what is best for you, get some professional advice.
Software, Markets and Data
There are dozens of free tools available online for investors. For me these are all pretty much useless. If you want to follow my methodology, you will need Updata. My methodology rests very heavily on the scans of large universes of stocks in minutes to find the handful with 50% upside, in an uptrend with a risk reward ratios greater than 2 to 1 on log scale point and figure charts. Updata is the only software that can do this. You can take a free trial and see for yourself. My portfolio's first week performance would have paid for the software and data for more than a year. You get what you pay for. Free internet tools are a false economy.
Updata Analytics is Updata's professional product which runs on services such as: Bloomberg, Datastream, Reuters and in-house databases.
Updata's private product TraderPro has most of the same features (all that are needed for running this methodology) and runs on more home based feed services such as: Barchart, eSignal, Google Finance, IQ Feed, MyTrack, Teletrader, Yahoo Finance and others. Updata also has a real time and delayed UK stock feed.
I am running purely on delayed data, daily end of day would be fine. Others will want real time. Learning not to be glued to your screen is a challenge which I will cover from week to week. I try and discipline myself not to look more than twice a day and it is the performance each week that really counts.
Market analysis and my themes
The screen below forms a big part of the analysis for my theme. The first chart is a weekly cloud chart of the S&P 500 Index. This was in a strong bull run in the 90's had a big sideways range for around 15 years and has now broken out and started to run again. The rule of thumb in technical analysis is that the move out of a pattern is roughly equal to the move into the pattern. This implies the US stock market is in a new long term bull market. The second chart is a 2% (long term) log scale point and figure chart with automatic trends and targets (SHIFT + T keys on Updata). Here we see upside targets to higher levels still. This is NOT my view of the US stock market. It is simply what these charts say.
The third chart (RH top) is a 1x3 chart of the dollar index which his just made a powerful quadruple top breakout and crossed the automated downtrend. This suggests the dollar is in a new long term uptrend.

The forth chart (LH bottom) is the weekly cloud chart of the FTSE 100 index. This market is still yet to make a new all time high, but the UK normally follows the US. The next 1% point and figure chart shows upside targets much higher then the current levels.
The last chart is the Sensex Index for the Indian stock market which has met previous upside targets and now has a new one at much higher levels. This will be the speculative end of my portfolio, but through managed funds/investment trusts. India also has the best demographics on the planet, not that us technicians care too much about such things.
One other interesting point is the markets often undergo jitters in October. 'Sell in May and go away, come back on Labor day.' So with these out of the way, November is normally a good time of year to invest. I will look at this further through seasonality studies in the coming weeks.
Choosing my stocks
With around £33,000 available to invest I have decided to buy 11 holdings of around £3,000 each and I will put 2 units into my Indian theme (UK investment trusts), 5 into UK stocks and 4 into US stocks to start with. Choosing the Indian units is pretty straight forward. I look at each of the charts, press SHIFT T and see which have the best upside and where I feel best about the look of the chart. My video course will help you with this skill.
Finding the best 5 UK stocks posses a bit more of a challenge. I have decided to limit myself to the FTSE 350 where there is quite good liquidity and run the scan. So I set the scan condition below.
I demonstrate this in an online video tutorial on stock scanning - HERE

I ran these scans for both the UK FTSE 350 index members and the US S&P 500 Index. I also did the Nasdaq 100. Then I scroll the point and figure charts looking for a mix of pattern, upside, multiple targets ('clusters'). I generally prefer stocks that are breaking out of sideways ranges or ascending triangles (see my course Session 1) over recoveries which have a tendency to fail or take longer. The whole idea of these thrust targets is covered in Jeremy du Plessis' book and the last session of my video course.
So I scroll through the charts of a universe of say 10-20 stocks that meet the scan criteria, looking for my top picks. I may need to scroll through them 2 or 3 times and the ones I feel look like the best looking stocks, I tag to a list of my interesting stocks (RH click, Tag to Watchlist). This scan is like my first filter.
I now run through my shorter watchlist of several stocks with Tracker Charts (in Updata RH click on the top LH corner of the chart) I have six charts as follows:
- Weekly cloud chart for the long term trend 'months'. Has to be above the cloud
- Daily cloud chart for the medium term trend 'weeks'. Has to be above the cloud, good if breaking to new highs
- 60 minute cloud chart for the short term trend 'day'. Market timing - see below
- 1% log scale long term point and figure chart - reconfirming breakout, targets, clusters and pattern
- 0.5% log scale medium term point and figure chart - checking for exhaustion/counter trend moves
- 0.1% log scale short term point and figure chart - market timing
Market Timing
You may not have access to the 60 minute data and these are the least two important charts in this process, but it can save you from buying something that might fall in the next few days (it often happens anyway) before it starts rising again.

Scoring system
I give each of my stocks a score for each chart. I copy the watchlist contents (RH click on list) out to a spreadsheet and enter the score beside each one. These typically range from 3 to 6 where I am looking to buy the stocks with a 5 or a 6. If you don't have 60 minute charts, look for 4s. It is good to have one or two more stocks in your list than you can invest in, so that when you come to do the buying you have a second choice available if one has already moved up (this often happens) or down in price quite dramatically.
Setting my stops
For this you need to watch my Optimised Exit Strategies module of the course. Once the buying decision is made all that matters to me is how I will manage the position. Using the S Key on Updata - I set best fit stoplosses around the current trend. I set my stops between 5% and 10% accordingly.
I then organise my screen like that below, with a quote board so I can see my performance each day and the stops on each chart. I also RH click on these charts to set alerts which can be emailed or SMS texted to me. For me email is fine. We will see in the coming weeks when I get a sell signal how it is dealt with.

One last check I make is to do a quick web search for the company name and takeover bid, just to check it is not a takeover situation where there may not be any more upside. Then I buy the top stocks in my list and from here it will just be a case of monitoring. I avoid the temptation to re-analyse the charts.
Let's see what happens in Week 1......
DL